The Azure PostgreSQL Workshop
Welcome to the Azure PostgreSQL Workshop — a hands-on, scenario-driven lab that takes you from zero to confidently operating Azure Database for PostgreSQL Flexible Server in production.
You will deploy infrastructure with Bicep, load realistic data, deliberately break things, observe the damage through monitoring, diagnose root causes, and fix them — the same cycle you follow in real operations.
This is a two-day workshop. We’ll move at a comfortable pace with plenty of time for questions, discussion, and troubleshooting. Whether you’re coming from an Oracle, SQL Server, or cloud-native background — please ask questions as we go. There are no silly questions, and the best workshops are the ones where everyone participates!
Who Is This For?
- Developers building applications on Azure PostgreSQL who want to understand the platform deeply
- Platform / DevOps engineers responsible for deploying, securing, and monitoring PostgreSQL on Azure
- DBAs migrating from Oracle, or on-premises PostgreSQL to Azure
Workshop Journey
Follow these 10 steps from infrastructure deployment to teardown:

| Step | Phase | What You Do |
|---|---|---|
| 1 — Deploy | Bicep → PG Flex + jumpbox + VNets, DNS, storage | Deploy the full environment or the simple server |
| 2 — Connect | SSH to jumpbox → psql, .pg_azure, .pgpass | Establish connectivity and store credentials securely |
| 3 — Load Data | pg_restore orders_demo — 4 tables, ~410K rows | Import a realistic e-commerce dataset |
| 4 — Break Workload | 6 heavy queries — CPU + IOPS + temp spills | Run intentionally unoptimised queries to generate load |
| 5 — Monitor | Azure Metrics, QPI, alerts, diagnostic settings | Observe the impact while the damage is fresh |
| 6 — Admin & Access | Roles, permissions, RBAC, PgBouncer pooling | Learn PostgreSQL access control and connection pooling |
| 7 — Protect | Backup, replication, HA/DR, security, patching | Cover business continuity and security management |
| 8 — Diagnose | DB profiling, MVCC, statistics, EXPLAIN, parameter tuning | Understand why the workload was slow |
| 9 — Fix | Index tuning lab — before → after comparison | Add the right indexes and prove the improvement |
| 10 — Clean Up | Delete resource group, remove credentials | Tear down all resources |
Day 1 — Deploy, Connect, Monitor, Administer & Protect
| Time | Session | What We’ll Do | Duration |
|---|---|---|---|
| 09:00 | Welcome & Setup | Introductions, prerequisites, Azure Cloud Shell | 30 min |
| 09:30 | Deploy | Bicep → PostgreSQL Flex + jumpbox + VNets, DNS, storage | 35 min |
| 10:05 | Connect | SSH to jumpbox, psql basics, SSH tunnels, VS Code | 40 min |
| 10:45 | ☕ Break | 15 min | |
| 11:00 | Load Data | Restore orders_demo (4 tables, ~410K rows), explore the schema | 25 min |
| 11:25 | Break the Workload | Run 6 intentionally heavy queries — CPU, IOPS, temp spills | 25 min |
| 11:50 | Q&A — Morning Recap | Questions on everything so far, troubleshoot any setup issues | 10 min |
| 12:00 | 🍽️ Lunch | 60 min | |
| 13:00 | Azure Monitoring | Portal metrics, QPI, KQL, alerts — correlate spikes to the demo queries | 35 min |
| 13:35 | Administration & Roles | Server parameters, roles, GRANT/REVOKE, INHERIT vs NOINHERIT | 50 min |
| 14:25 | ☕ Break | 15 min | |
| 14:40 | Logical Backup | pg_dump / pg_restore — formats, selective restore, verification | 25 min |
| 15:05 | Business Continuity | Physical backup & PITR, HA/DR failover, security & patching | 30 min |
| 15:35 | Q&A — Day 1 Wrap-up | Open discussion, review key concepts, preview of Day 2 | 25 min |
| 16:00 | End of Day 1 |
Day 2 — Profile, Diagnose & Fix
| Time | Session | What We’ll Do | Duration |
|---|---|---|---|
| 09:00 | Day 2 Kick-off | Quick recap of Day 1, questions from overnight | 10 min |
| 09:10 | Database Profiling | 22 diagnostic queries — health check & performance triage scripts | 50 min |
| 10:00 | ☕ Break | 15 min | |
| 10:15 | MVCC & Autovacuum | Dead tuples, VACUUM vs VACUUM FULL, bloat, autovacuum tuning | 30 min |
| 10:45 | Parameter Tuning | work_mem, shared_buffers, effective_cache_size — measure the impact | 30 min |
| 11:15 | Q&A — Internals | Pause for questions — this is the densest part of the workshop | 15 min |
| 11:30 | SQL Characteristics | Partial indexes, JSONB, GIN indexes — PostgreSQL superpowers | 20 min |
| 11:50 | Statistics & Query Planning | EXPLAIN, cost model, join algorithms — nested loop vs hash vs merge | 25 min |
| 12:15 | 🍽️ Lunch | 60 min | |
| 13:15 | Index Tuning Lab | Add 5 indexes, re-run the broken workload, measure 2–50× speedup | 45 min |
| 14:00 | ☕ Break | 15 min | |
| 14:15 | Extensions (optional) | pg_trgm, uuid-ossp, pgcrypto, pg_cron | 20 min |
| 14:35 | Clean Up | Delete resource group, verify everything is gone | 10 min |
| 14:45 | Final Q&A & Wrap-up | Open floor — ask anything! Feedback, next steps, resources | 30 min |
| 15:15 | End of Workshop |
What You Will Learn
| Theme | Topics |
|---|---|
| Deployment & Access | Bicep IaC, Azure Flexible Server provisioning, networking (VNet, private DNS, peering), connection methods (psql, SSH tunnel, VS Code), roles & permissions, connection pooling |
| Business Continuity & Security | Logical backup (pg_dump / pg_restore), physical backup & PITR, logical replication, HA/DR with zone redundancy, patching & maintenance windows, pgAudit & security management |
| Day Two Operations | Azure Monitor metrics, Query Performance Insight, database profiling (catalog views), MVCC & autovacuum, parameter tuning (work_mem, shared_buffers), EXPLAIN & statistics, index tuning, SQL features (partial indexes, JSONB), extensions |
Prerequisites
Before you begin, make sure you have the items below ready. The exact requirements depend on which deployment option you choose — see the comparison table at the bottom of this page.
Azure Subscription
You need an Azure subscription with Contributor access.
- Sign in at https://portal.azure.com
- Authenticate the Azure CLI:
az login
Required Tools
| Tool | Download | Required for |
|---|---|---|
| Azure CLI | Install Azure CLI | All options |
| SSH client | Built into Windows 10+, macOS, Linux | Option 1 (Enterprise) |
| psql (PostgreSQL client) | Pre-installed on jumpbox VM (Option 1), or install locally via PostgreSQL downloads | All options |
| VS Code + PostgreSQL extension (optional) | Download VS Code + install PostgreSQL extension | Option 2, Option 3 (or via SSH tunnel with Option 1) |
Shell Environment
Your choice of shell depends on your deployment option:
- Option 1 (Enterprise): Use Azure Cloud Shell (Bash) to deploy. After deployment, you SSH into the jumpbox Linux VM which has
psql,pg_dump,pg_restore, and other PostgreSQL 18 utilities pre-installed. All database work happens on the jumpbox. - Option 2 (Simple) / Option 3 (BYOS): Use any terminal — Azure Cloud Shell, PowerShell, Bash, or Windows Terminal. You connect to PostgreSQL directly from your machine, so you need
psqlinstalled locally (or use the VS Code PostgreSQL extension or the Azure Portal Connect blade).
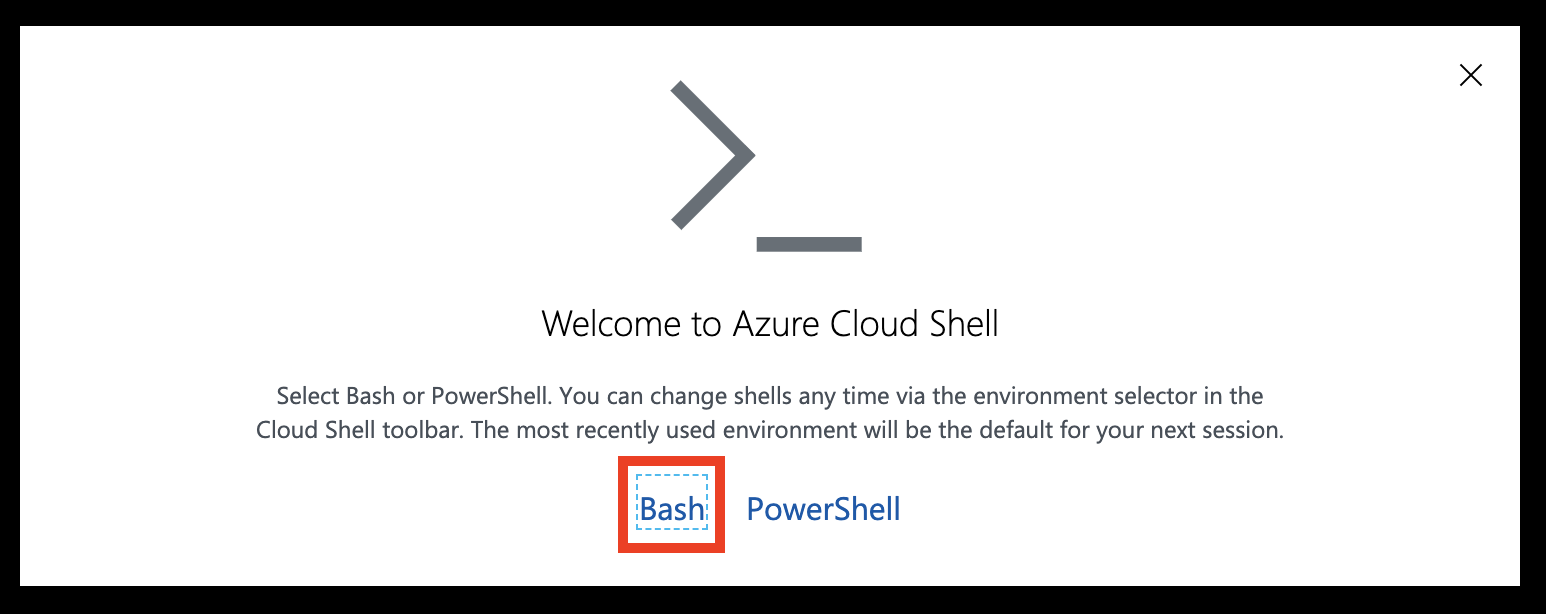
Head over to https://shell.azure.com and sign in.
Select Bash as your shell.
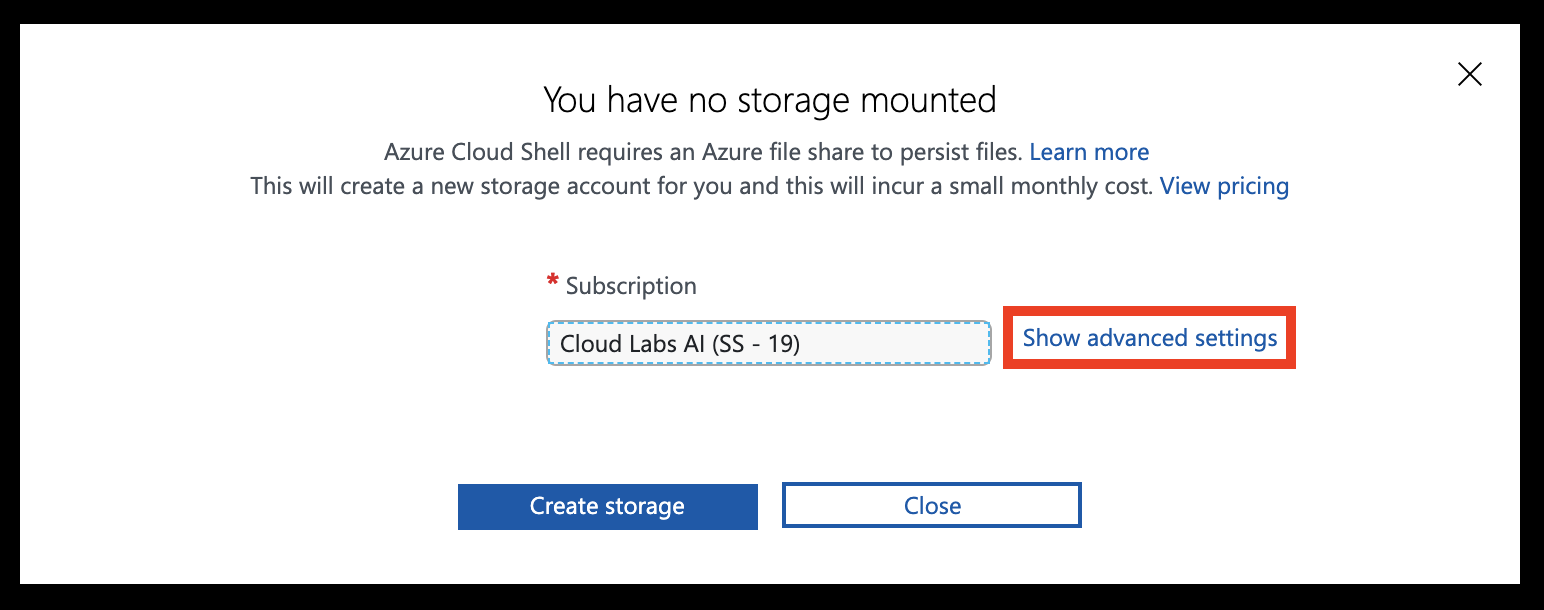
Select Show advanced settings
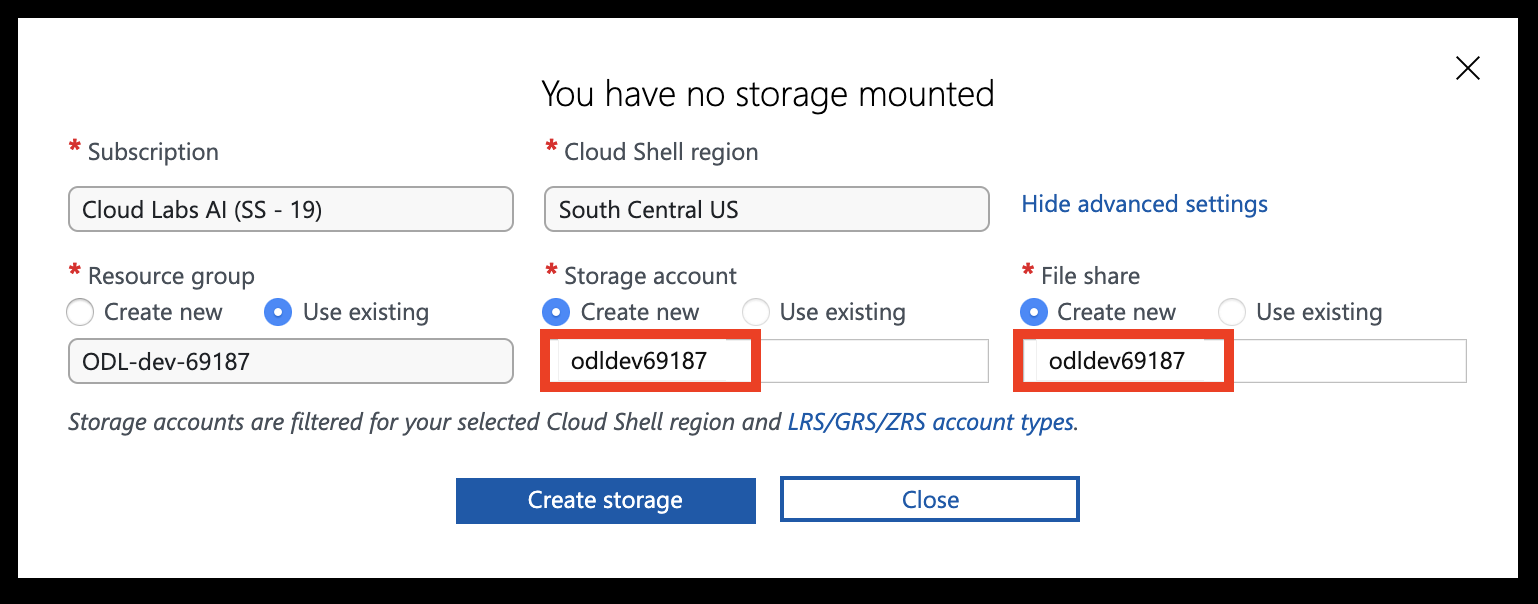
Set the Storage account and File share names to your resource group name (all lowercase, without special characters), then click Create storage.
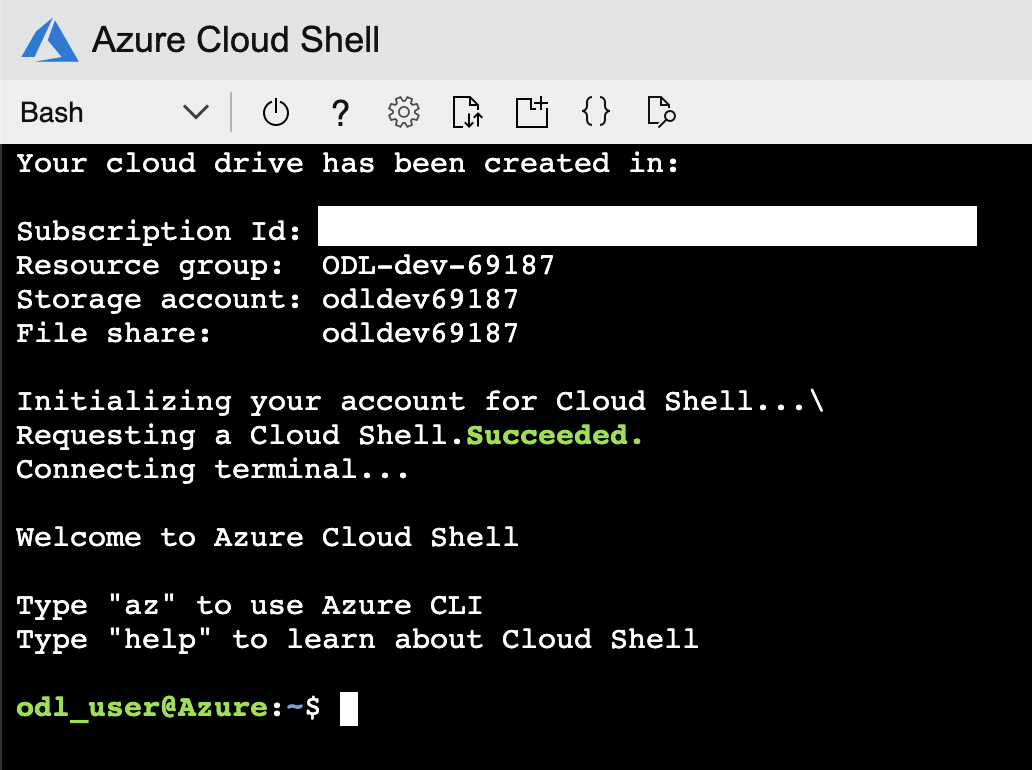
You should now have access to the Azure Cloud Shell.
Deployment Options
The workshop provides three deployment options. Choose the one that best fits your scenario.
| Option 1 — Enterprise | Option 2 — Simple | Option 3 — BYOS | |
|---|---|---|---|
| What’s deployed | Hub-spoke VNet, jumpbox VM, PG Flex (private access), private DNS | PG Flex (public access) + firewall rule | Nothing — you bring your own server |
| How you connect | SSH → jumpbox → psql (private network) |
Direct from your machine (psql, VS Code, Portal) |
Direct or via jumpbox |
| SSH tunnel needed? | Yes — for GUI tools (VS Code, pgAdmin) on your laptop | No | Depends on your setup |
| Cloud Shell required? | Recommended for deployment | No — any terminal works | No |
| Best for | Enterprise private networking scenarios | Quick start, developer-focused | Instructor-led or pre-provisioned |
Option 1 — Enterprise Deployment (Recommended)
Deploy the complete hub-and-spoke architecture using Bicep. This is the default path used throughout the workshop.
What gets deployed:
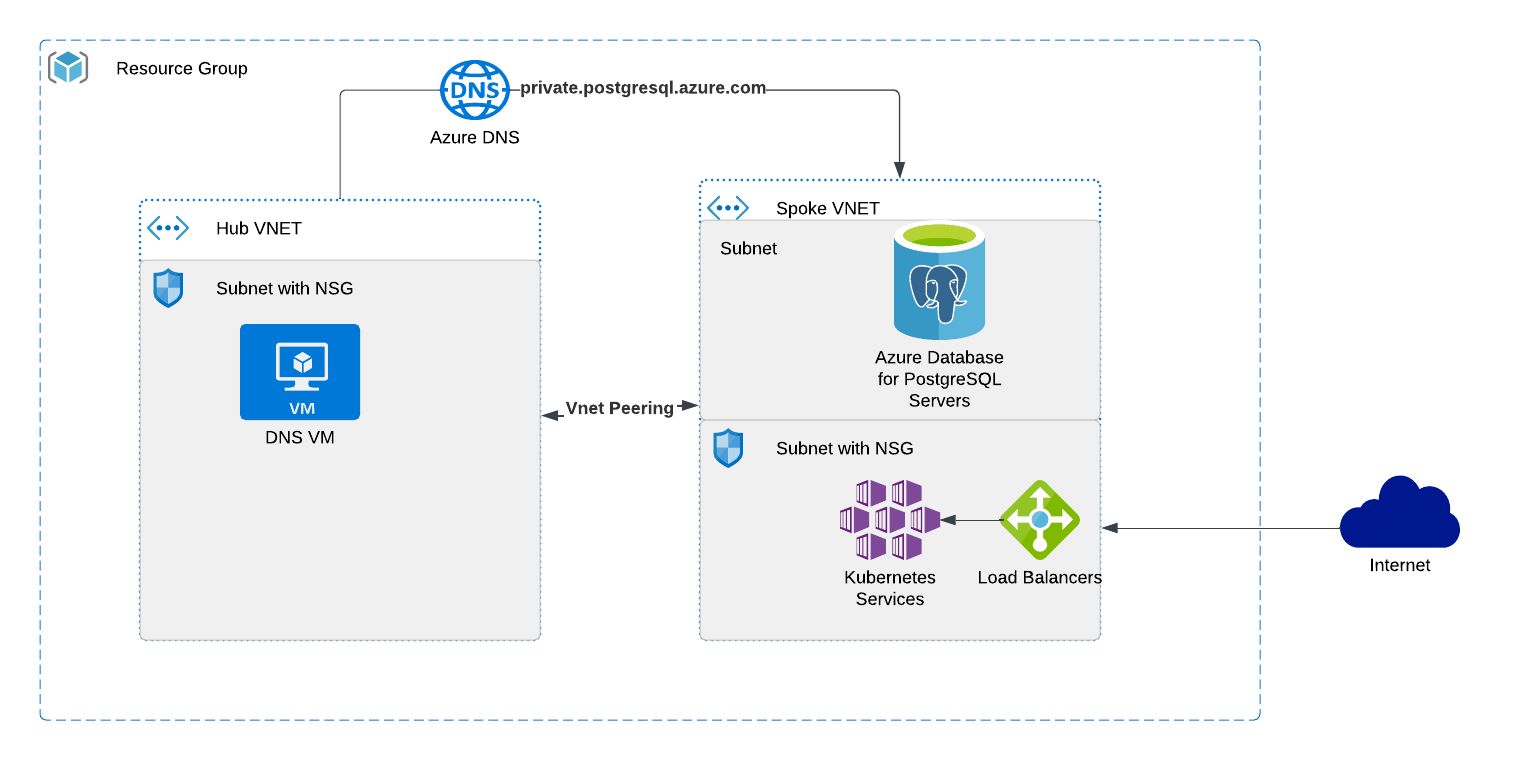
- Hub VNet with a jumpbox Linux VM (Rocky Linux 9, PostgreSQL 18 client pre-installed)
- Spoke VNet with Azure Database for PostgreSQL Flexible Server (private access via delegated subnet)
- VNet peering between hub and spoke
- Private DNS zone (
private.postgres.database.azure.com) - NSG with SSH access
- Storage account (for diagnostic logs)
How to connect:
- SSH into the jumpbox VM from Cloud Shell or your local terminal
- Use
psqldirectly on the jumpbox to reach PostgreSQL over the private network - (Optional) Set up an SSH tunnel to use GUI tools (VS Code PostgreSQL extension, pgAdmin) from your laptop — see Connecting to PostgreSQL for details
Best for: Enterprise-like scenarios with private networking, DNS resolution, and a jump-box access pattern.
Option 2 — Simple Deployment (Public Access)
Deploy only a PostgreSQL Flexible Server with public network access and a firewall rule for your IP. No VNet, no jumpbox, no DNS.

What gets deployed:
- Azure Database for PostgreSQL Flexible Server (public access, firewall whitelist)
How to connect: Directly from your machine using:
psql(install locally or use Cloud Shell)- VS Code PostgreSQL extension
- Azure Portal → PostgreSQL server → Connect blade
No SSH tunnel needed.
Best for: Quick start, simple labs, or when you already have a PostgreSQL client installed and want minimal setup.
See the Deploy with Bicep section for step-by-step instructions.
Option 3 — Bring Your Own Server
If you already have an Azure Database for PostgreSQL Flexible Server (or are attending an instructor-led session where infrastructure is pre-provisioned), skip the deployment section entirely and proceed to Connecting to PostgreSQL.

You will need:
- PostgreSQL server FQDN
- Admin username and password
- Jumpbox VM IP address (if applicable) and SSH credentials
- Network access (either public endpoint with your IP whitelisted, or SSH to the jumpbox)
Tips for Azure Cloud Shell
- Use
code <filename>to open the built-in text editor - Drag and drop files to upload them
- Use
curl -o filename.ext https://url/filename.extto download files directly
Next: Once your prerequisites are ready, head to Deploy Azure Database for PostgreSQL with Bicep to provision your environment.
Getting up and running
Deploy Azure Database for PostgreSQL with Bicep
In this section you will deploy the workshop environment using Bicep. Choose the option that matches your scenario.
Prerequisites
- Windows 10/11 with PowerShell, macOS, or Linux (or use Azure Cloud Shell)
- Azure CLI installed
- An Azure subscription with Contributor access
Option 1 — Enterprise Deployment
Deploys the full hub-and-spoke architecture: jumpbox VM, private VNet, PostgreSQL Flexible Server with private access, and a private DNS zone.
Step 1 — Download the Bicep templates
Open Azure Cloud Shell (Bash), or a local terminal with Azure CLI installed, and download the templates:
curl -O https://pg.azure-workshops.cloud/scripts/bicep.zip
unzip bicep.zip
cd bicep
PowerShell? Use
Invoke-WebRequestinstead:Invoke-WebRequest -Uri https://pg.azure-workshops.cloud/scripts/bicep.zip -OutFile bicep.zip Expand-Archive bicep.zip -DestinationPath . cd bicep
Step 2 — Log in to Azure
az login
This opens a browser window. Sign in with your Azure account.
Verify you are on the correct subscription:
az account show --query "{name:name, id:id, state:state}" -o table
If the subscription shown is not the one you intend to use, list all available subscriptions and set the correct one:
az account list --query "[].{Name:name, ID:id, Default:isDefault}" -o table
az account set --subscription "<subscription-name-or-id>"
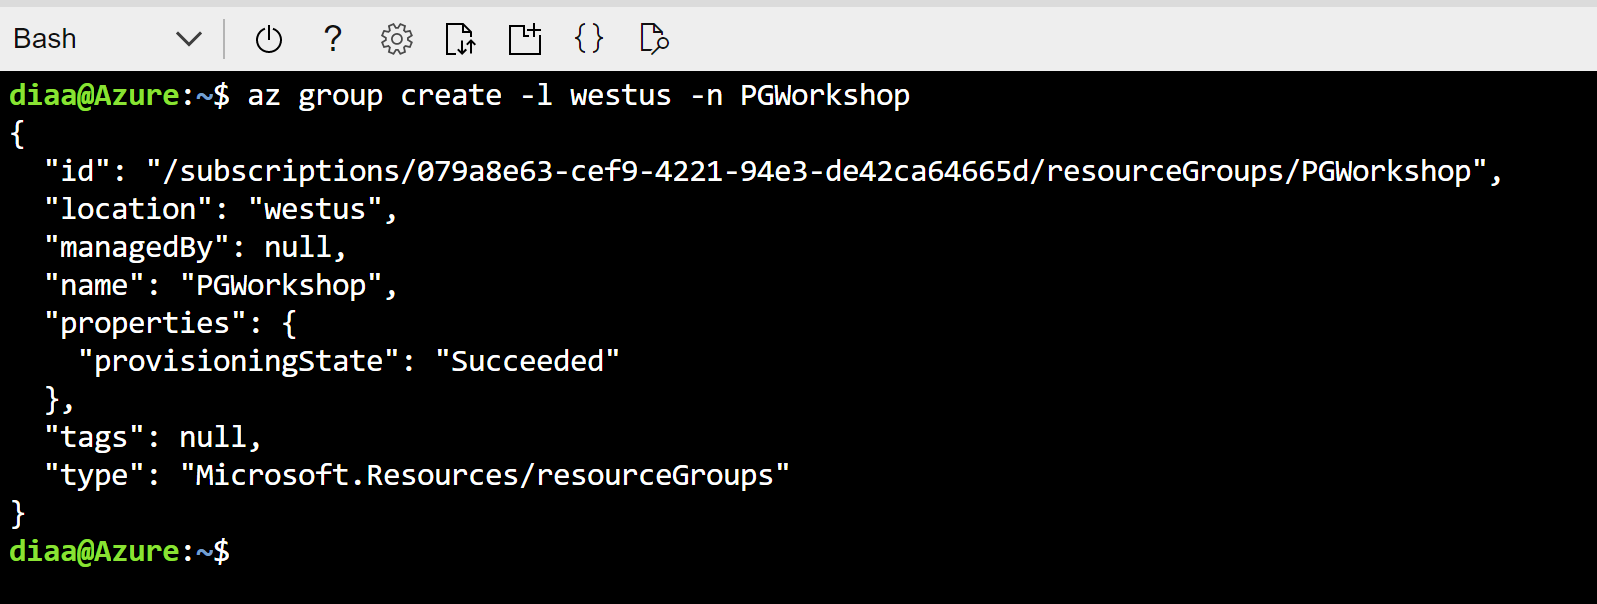
Step 3 — Create the resource group
az group create --name PG-Workshop --location uksouth
Step 4 — Deploy the Bicep template
az deployment group create --resource-group PG-Workshop --template-file main.bicep
You will be prompted for four values:
| Parameter | Description |
|---|---|
vmAdminUsername |
Username for the jumpbox VM (e.g. workshopuser) |
vmAdminPassword |
A strong password for the jumpbox VM |
postgreSqlAdministratorLogin |
Username for PostgreSQL — use your name, avoid admin or root |
postgreSqlAdministratorLoginPassword |
A strong password (min 8 chars, mix of upper/lower/number/special) |
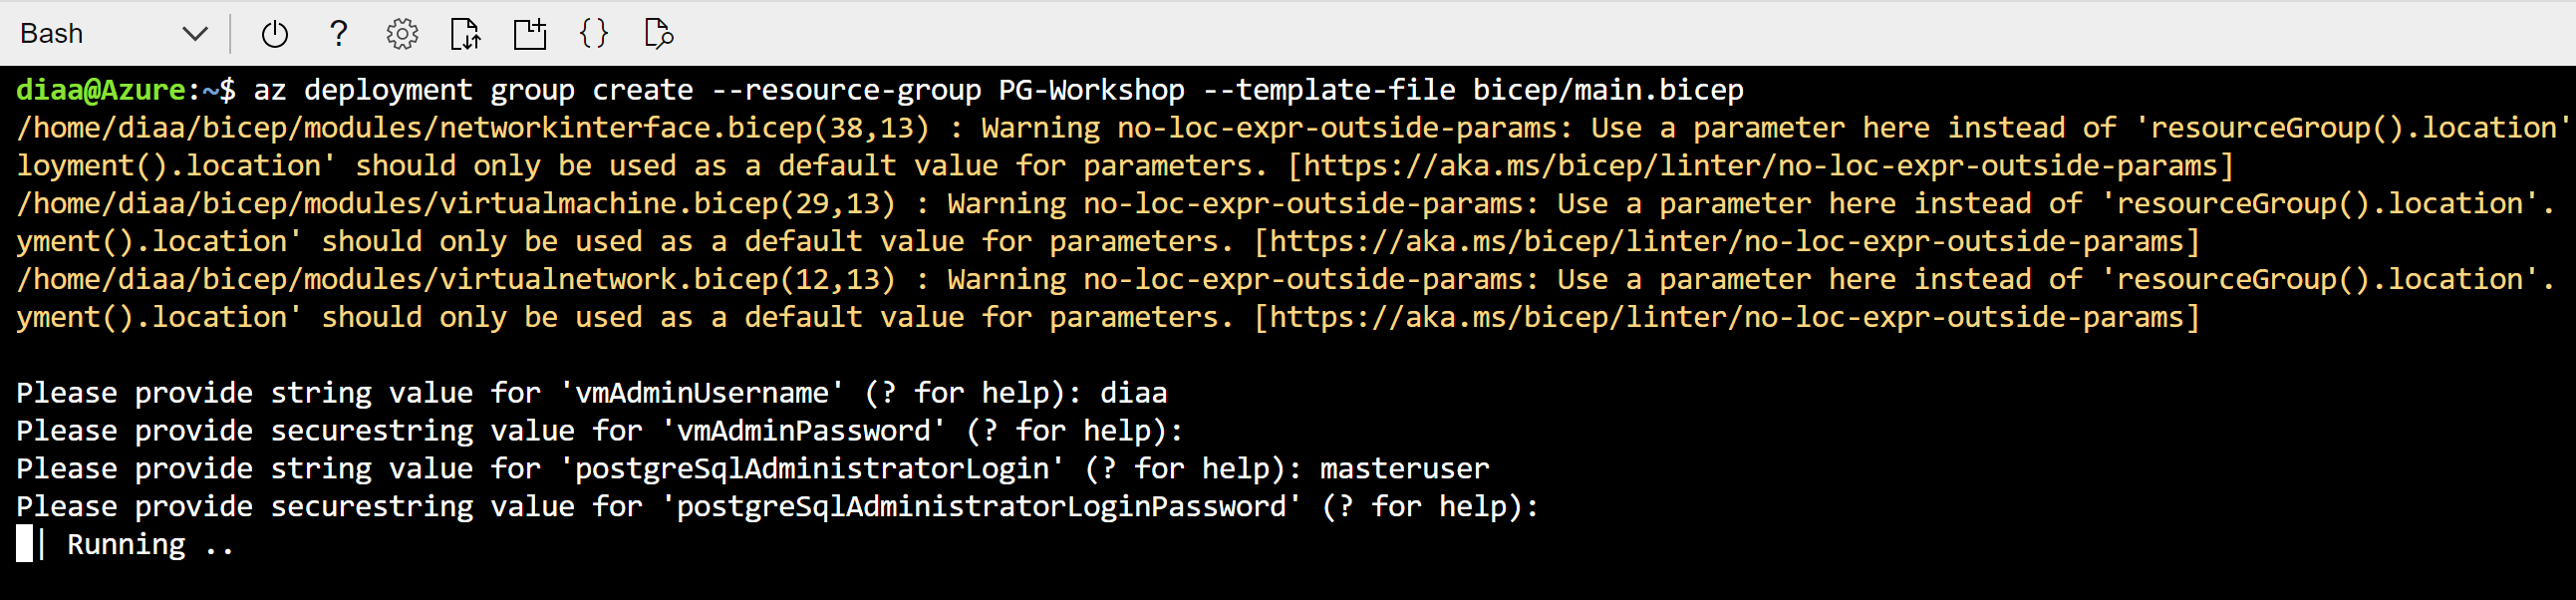
The deployment takes approximately 10–15 minutes. When it finishes, note the outputs — they contain the jumpbox public IP and the PostgreSQL FQDN.
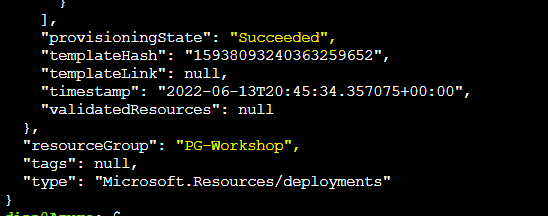
Step 5 — Verify resources and collect connection details
Go to Resource Groups in the Azure Portal and click on PG-Workshop. You should see:
- Jumpbox VM (
jumpbox) - PostgreSQL Flexible Server
- Hub and Spoke virtual networks
- Private DNS zone
- Network security group
- Storage account
Keep these values accessible — you will use them in every subsequent section:
| Value | Where to find it |
|---|---|
| Jumpbox VM public IP | Azure Portal → PG-Workshop → jumpbox VM → Overview → Public IP address |
| PostgreSQL FQDN | Azure Portal → PG-Workshop → PostgreSQL Flexible Server → Overview → Server name |
| VM admin username | The vmAdminUsername you entered in Step 4 |
| PostgreSQL admin username | The postgreSqlAdministratorLogin you entered in Step 4 |
Step 6 — SSH into the jumpbox and verify connectivity
ssh <vmAdminUsername>@<jumpbox-public-ip>
Use the password you provided in Step 4. Once connected, verify the PostgreSQL client is installed:
psql --version
You should see psql (PostgreSQL) 18.x. Then test connectivity to the database:
psql -h <postgresql-fqdn> -U <pgAdminUsername> -d postgres
Enter the PostgreSQL password when prompted. If you see the postgres=> prompt, the deployment is working correctly.
Check the PostgreSQL server version:
SELECT version();
You should see output containing PostgreSQL 18.x. To exit psql:
\q
Next: Proceed to Connecting to PostgreSQL for detailed connection methods, SSH tunnels, and VS Code setup.
Option 2 — Simple Deployment (Public Network)
Deploys only a PostgreSQL Flexible Server with a public endpoint and a firewall rule for your IP. No jumpbox VM is created — you connect directly from your machine.
Step 1 — Download templates and navigate to the simple folder
If you haven’t already downloaded the templates, do so now (see Option 1 — Step 1). Then navigate to the simple folder:
cd bicep/simple
Step 2 — Log in and create the resource group
Skip this step if you already logged in and created the resource group above.
az login
az group create --name PG-Workshop --location uksouth
Step 3 — Get your public IP
On PowerShell (Windows):
(Invoke-WebRequest -Uri "https://ifconfig.me/ip").Content
On Bash (Linux/macOS/Cloud Shell):
curl -s ifconfig.me
Note the IP address returned.
Step 4 — Deploy
az deployment group create --resource-group PG-Workshop \
  --template-file main.bicep \
  --parameters clientIPAddress="<your-public-ip>"
You will be prompted for:
| Parameter | Description |
|---|---|
administratorLogin |
Username for PostgreSQL (e.g. pgadmin) |
administratorPassword |
A strong password (min 12 chars, mix of upper/lower/number/special) |
Step 5 — Connect from your local machine
The deployment output includes a ready-to-use psqlCommand. If you have psql installed locally:
psql "host=<server-fqdn> user=<administratorLogin> dbname=postgres sslmode=require"
If you do not have psql installed, you can connect from the Azure Portal: go to your PostgreSQL server → Connect blade.
Step 6 — Verify resources and collect connection details
Go to Resource Groups in the Azure Portal and click on PG-Workshop. You should see:
- PostgreSQL Flexible Server
- Firewall rule with your IP address
Keep these values accessible — you will use them in every subsequent section:
| Value | Where to find it |
|---|---|
| PostgreSQL FQDN | Azure Portal → PG-Workshop → PostgreSQL Flexible Server → Overview → Server name |
| PostgreSQL admin username | The administratorLogin you entered in Step 4 |
Once connected via psql, check the PostgreSQL server version:
SELECT version();
You should see output containing PostgreSQL 18.x. To exit psql:
\q
Next: Proceed to Connecting to PostgreSQL for detailed connection methods and VS Code setup.
Connecting to PostgreSQL
This section covers how to connect to your Azure Database for PostgreSQL Flexible Server, set up convenient environment variables, and store credentials securely. Since the database is deployed inside a VNet with private access, you need to go through the jumpbox VM to reach it.
You will need the following values from your deployment output:
- Jumpbox Public IP (
vmPublicIp) - PostgreSQL FQDN (
postgreSqlFqdn) - PostgreSQL Admin Username (
postgreSqlUsername) - VM Admin Username (
vmUsername)
Method 1: SSH into the Jumpbox and use psql
The simplest approach — SSH into the jumpbox and connect directly.
# SSH into the jumpbox
ssh <vmUsername>@<jumpbox-ip>
Once on the jumpbox, connect to PostgreSQL:
psql -h <postgresql-fqdn> -U <pgadmin> -d postgres
You should see the PostgreSQL prompt. Verify with:
SELECT version();
Tip: After verifying your connection works, set up environment variables and
.pgpass(see the Connection Best Practices section below) so you never have to type the full connection string again.
Method 2: SSH Tunnel (connect from your local machine)
Create an SSH tunnel to forward a local port through the jumpbox to the PostgreSQL server.
Step 1: Create the tunnel
Open a terminal on your local machine:
ssh -v -fN -L 5433:<postgresql-fqdn>:5432 <vmUsername>@<jumpbox-ip>
Flags explained:
-v— verbose output so you can see the tunnel being established-f— run in background after authentication-N— don’t execute a remote command (tunnel only)-L 5433:<fqdn>:5432— forward local port 5433 to the remote PostgreSQL port 5432
Step 2: Verify the tunnel is open
On Windows (PowerShell):
netstat -an | findstr 5433
On Linux/macOS:
lsof -i :5433
You should see the port in LISTEN state.
Step 3: Connect through the tunnel
psql -h localhost -p 5433 -U <pgadmin> -d postgres
To close the tunnel:
# Find the SSH process
ps aux | grep "ssh -.*5433"

# Kill it
kill <pid>
On Windows:
Get-Process ssh | Where-Object { $_.CommandLine -match "5433" } | Stop-Process
Method 3: VS Code PostgreSQL Extension
The VS Code PostgreSQL extension lets you run queries directly from the editor.
Step 1: Set up the SSH tunnel
You need the tunnel from Method 2 running first. Open a terminal and run:
ssh -fN -L 5433:<postgresql-fqdn>:5432 <vmUsername>@<jumpbox-ip>
Step 2: Install the PostgreSQL extension
- Open VS Code
- Go to Extensions (
Ctrl+Shift+X) - Search for PostgreSQL (by Microsoft)
- Click Install
Step 3: Create a new connection
- Click the PostgreSQL icon in the left sidebar
- Click + Create Connection Profile
- Fill in:
- Server name:
localhost - Port:
5433 - Database name:
postgres - Authentication type: Password
- User name: your PostgreSQL admin username
- Password: your PostgreSQL admin password
- Connection name: give it a friendly name (e.g.,
Workshop DB)
- Server name:
- Click Connect
Step 4: Run queries
- Right-click your connection and select New Query
- Type your SQL:
SELECT version();
- Press
Ctrl+Shift+Eor click Run to execute
You can also browse tables, views, and functions in the sidebar tree.
Method 4: VS Code PostgreSQL Extension (Simple Deployment)
If you deployed using bicep/simple/main.bicep, the server has public access enabled with a firewall rule for your IP. No SSH tunnel needed.
- Open the PostgreSQL sidebar in VS Code
- Click + Create Connection Profile
- Fill in:
- Server name:
<postgresql-fqdn>(directly, no tunnel) - Port:
5432 - Database name:
postgres - User name: your admin username
- Password: your admin password
- Server name:
- Connect and query directly
Connection Best Practices
Once you have verified your connection works using one of the methods above, set up environment variables and a .pgpass file on the jumpbox. This avoids typing connection parameters repeatedly and keeps your password out of shell history.
Step 1 — Set libpq Environment Variables
libpq environment variables are recognized by psql, pg_dump, pg_restore, and all PostgreSQL client tools.
Create a file on the jumpbox:
cat > ~/.pg_azure << 'EOF'
export PGHOST=<postgresql-fqdn>
export PGUSER=<pgadmin>
export PGDATABASE=orders_demo
export PGSSLMODE=require
EOF
Or download the template and edit it:
curl -o ~/.pg_azure https://pg.azure-workshops.cloud/scripts/pg_azure
Then update the values in ~/.pg_azure with your actual hostname and username.
Source it in your current session:
source ~/.pg_azure
Tip: Add
source ~/.pg_azureto your~/.bashrcso the variables are set automatically on every login.
Notice that PGPASSWORD is intentionally omitted. Exporting your password as an environment variable is insecure — it is visible in /proc/<pid>/environ, in shell history, and to any process running as the same user. Use .pgpass instead.
Step 2 — Store Passwords Securely with .pgpass
The ~/.pgpass file provides password lookup for libpq clients without exposing the password in the environment. The format is:
hostname:port:database:username:password
Create the file:
echo "<postgresql-fqdn>:5432:*:<pgadmin>:<your-password>" > ~/.pgpass
chmod 600 ~/.pgpass
The * in the database field means this password applies to all databases on that server. The chmod 600 is required — PostgreSQL ignores .pgpass if the permissions are too open.
Now connect without any parameters:
psql
You should connect directly to orders_demo (from PGDATABASE) on the Flexible Server (from PGHOST) with no password prompt.
Step 3 — Getting the Connection String from the Azure Portal
The Azure Portal provides ready-made connection strings for various languages and tools.
- Go to your PostgreSQL Flexible Server in the Azure Portal
- In the left menu, click Connection strings
- Copy the psql connection string
This is useful as a reference — but for day-to-day work during the workshop, the environment variables + .pgpass approach above is faster and more secure.
Troubleshooting
SSH tunnel fails to connect:
- Verify the jumpbox public IP is correct
- Check that NSG allows SSH (port 22) from your IP
- Ensure the jumpbox VM is running:
az vm show -g apg-workshop-rg -n jumpbox --query powerState
psql: could not connect to server:
- Verify the tunnel is active:
netstat -an | findstr 5433 - Check that you are using the correct port (
5433for tunnel,5432for direct) - Verify the PostgreSQL FQDN resolves on the jumpbox:
nslookup <postgresql-fqdn>
VS Code connection timeout:
- Make sure the SSH tunnel is running before creating the connection
- Check that the port matches (5433 for tunnel)
- Try disconnecting and reconnecting the profile
DNS resolution fails on the jumpbox:
- Verify BIND is running:
systemctl status named - Test resolution:
dig <postgresql-fqdn> - If BIND is not running, restart it:
sudo systemctl restart named
.pgpass not working:
- Check permissions:
ls -la ~/.pgpass— must be-rw-------(600) - Verify the hostname matches exactly (including
.postgres.database.azure.com) - Ensure no trailing whitespace in the file:
cat -A ~/.pgpass
psql: The PostgreSQL Command-Line Client
psql is the interactive terminal for PostgreSQL. You will use it throughout this workshop to run queries, explore schemas, import data, and administer the server. This section teaches you the essential skills for working with psql efficiently.
Prerequisite: You should have connected to PostgreSQL from the jumpbox in the previous section. If your environment variables and
.pgpassare set up, simply runpsqlto connect.
Code block conventions used throughout this workshop:
- ` ```sh ` — run in the Linux shell on the jumpbox
- ` ```sql ` — SQL sent to the PostgreSQL server (type inside psql)
- ` ```psql ` — psql meta-commands (type inside psql, processed by the client — not sent to the server)
Backslash Meta-Commands
Anything you type in psql that begins with a backslash (\) is a meta-command — it is processed by the psql client itself, not sent to the PostgreSQL server.
Note: The meta-commands for exploring databases, schemas, tables, indexes, and roles (
\l,\dt,\dn,\du,\d, etc.) are covered step-by-step in the Load Data section, where you will use them hands-on against real data. This section focuses on thepsqlsession skills you need to work efficiently.
\conninfo — Always Verify Your Connection First
Before running any commands, confirm that you are connected to the right server, database, and user:
\conninfo
Example output:
You are connected to database "postgres" as user "pgadmin" on host "myserver.postgres.database.azure.com" at port "5432".
SSL connection (protocol: TLSv1.3, cipher: TLS_AES_256_GCM_SHA384, bits: 256, compression: off)
What each field tells you:
| Field | Why it matters |
|---|---|
| database | Confirms you are on postgres (default) or orders_demo (after restore) — a wrong database is the #1 cause of “table not found” errors |
| user | Confirms the role you connected as — important for privilege troubleshooting |
| host | Full FQDN of the Flexible Server — confirms you are not on localhost by mistake |
| port | Should be 5432 (direct) or 6432 if you are going through PgBouncer |
| SSL | Confirms the connection is encrypted — Azure Flexible Server enforces TLS by default |
Run \conninfo any time you are unsure which server or database your session is on.
Display Modes
By default, psql displays query results as a horizontal table. This becomes unreadable when tables have many columns.
Toggle expanded (vertical) display:
\x auto
With \x auto, psql automatically switches to vertical display when the output is too wide for your terminal. Try it:
SELECT * FROM pg_stat_activity;
Without \x auto, this is a wall of text. With it, each row is displayed vertically.
Toggle query timing:
\timing
This shows how long each query takes. Enable it now — you will want it for every query in the workshop.
Getting Help
\?            -- list all backslash meta-commands
\h            -- list all SQL commands
\h CREATE TABLE  -- show syntax help for a specific SQL command
Watching a Query
\watch re-runs the last query at a set interval — useful for monitoring:
SELECT count(*) FROM pg_stat_activity;
\watch 2
This re-runs the query every 2 seconds. Press Ctrl+C to stop.
Command History
\s -- print command history
Use Ctrl+R to search history interactively — type part of a previous command and psql will find it.
Inspecting Functions
You can view the source of any function:
\sf abs(bigint)
This prints the CREATE FUNCTION definition — useful for understanding built-in or custom functions.
Running SQL from a File
Instead of pasting SQL into psql, you can run a file:
\i /path/to/script.sql
Or from the command line:
psql -f /path/to/script.sql
This is how you will restore database dumps and run batch scripts later in the workshop.
Running a single command from the shell
If .pgpass and .pg_azure are set up, you can run one-off SQL directly from the shell with -c:
psql -c "CREATE DATABASE orders_demo;"
You will use this in the next section to create the workshop database before loading data.
Quick Reference
| Command | Purpose |
|---|---|
\conninfo |
Show current connection (host, port, user, database, SSL) |
\x auto |
Auto-toggle vertical display for wide results |
\timing |
Toggle query execution time display |
\watch N |
Re-run last query every N seconds |
\s |
Print command history |
\sf <func> |
Show function definition |
\i file |
Run SQL from a file |
\? |
List all backslash meta-commands |
\h <cmd> |
SQL syntax help for a command |
\q |
Quit psql |
Navigation commands (
\l,\dt,\dn,\d <table>,\du, etc.) are covered hands-on in the Load Data section.
Load Data — Restore the Sample Database
In this section you will restore a sample e-commerce database (orders_demo) with four tables and ~410K rows, then explore its schema to understand the data you will work with throughout the rest of the workshop.
Step 1 — SSH into the Jumpbox
Connect to the jumpbox VM using the public IP from your deployment output:
ssh <vmUsername>@<jumpbox-public-ip>
Replace
<vmUsername>and<jumpbox-public-ip>with the values from your Bicep deployment output.
Step 2 — Connect to PostgreSQL with psql
From the jumpbox, connect to the default postgres database:
psql -h <postgresql-fqdn> -U <pgadmin> -d postgres
You should see the postgres=> prompt.
Step 3 — Explore the Server Before Loading Data
Before restoring any data, run the following meta-commands to understand what is already on the server. These are psql backslash commands — they are not SQL; they are interpreted by the psql client itself.
psql session skills (
\timing,\x,\watch,\conninfo,\i,\?) are covered in the previous psql: The PostgreSQL Command-Line Client section. This step focuses on navigation commands that explore what is on the server.
Tip: Want to see the SQL behind any
\command? Run\set ECHO_HIDDEN onin psql — it will print the underlying query before each result. This is useful for learning and for reproducing meta-commands in other SQL clients like VS Code.
3.1 — List all databases
\l
What it does: Lists every database in the PostgreSQL cluster, including the owner, encoding, collation, and access privileges. You will see the default databases (postgres, azure_maintenance, azure_sys). After the restore in Step 4 you will see orders_demo here as well.
3.2 — List schemas
\dn
What it does: Lists all schemas in the current database. By default you will see public. Schemas are namespaces that let you organise tables, views, and functions within a single database.
3.3 — List all tables in all schemas
\dt *.*
What it does: The wildcard pattern *.* means “every table in every schema.” This shows you system catalog tables (in pg_catalog and information_schema) plus any user tables in public. Use this to get a quick inventory of what exists.
3.4 — List all views in all schemas
\dv *.*
What it does: Same idea as \dt but for views. Views are stored queries that act like virtual tables. You will see many built-in system views in pg_catalog and information_schema.
3.5 — List all indexes in all schemas
\di *.*
What it does: Lists every index across all schemas. Indexes speed up queries by providing fast lookup paths. Notice which tables have indexes and which do not — this will be relevant when you run the heavy queries in the next section.
3.6 — Additional useful meta-commands
| Command | Description |
|---|---|
\l+ |
Databases with sizes and tablespace info |
\dt+ |
Tables with sizes (current database, public schema) |
\d <table> |
Describe a specific table — columns, types, constraints |
\df *.* |
List all functions in all schemas |
\du |
List all roles / users |
\conninfo |
Show current connection info (host, port, user, database) |
\timing |
Toggle query execution timing on/off — very useful for benchmarks |
\x |
Toggle expanded (vertical) display for wide result sets |
Tip: Run
\timingnow so that every query you run from this point forward shows how long it took.
Step 4 — Download and Restore the Sample Database
4.1 — Exit psql
\q
4.2 — Download the dump file
The workshop uses a pre-built custom-format dump that contains four tables with realistic e-commerce data (~410K rows total).
curl -L -O "https://pg.azure-workshops.cloud/database/orders_demo.dump"
Verify the file downloaded correctly:
ls -lh orders_demo.dump
You should see a file of roughly 5–10 MB. If the file is missing or 0 bytes, check the URL and try again.
4.3 — Create the target database
psql -h <postgresql-fqdn> -U <pgadmin> -d postgres -c "CREATE DATABASE orders_demo;"
Tip: If you configured
.pg_azureand.pgpassin the previous section, you can omit-hand-Uand you won’t be prompted for a password:psql -c "CREATE DATABASE orders_demo;"
4.4 — Restore the dump with pg_restore
pg_restore -h <postgresql-fqdn> -U <pgadmin> -d orders_demo --no-owner --no-privileges --verbose orders_demo.dump
With
.pg_azureand.pgpassconfigured:pg_restore -d orders_demo --no-owner --no-privileges --verbose orders_demo.dump
Flag reference:
--no-owner— skip ownership assignment (avoids errors when the original owner doesn’t exist on this server)--no-privileges— skip privilege (GRANT/REVOKE) statements from the source--verbose— print progress as each object is restored
You should see output listing each table and index being created, followed by data loading via COPY. If you see errors about roles not existing, they are safe to ignore (that’s what --no-owner handles).
4.5 — Verify the restore succeeded
Connect to the new database and confirm the tables exist with data:
psql -h <postgresql-fqdn> -U <pgadmin> -d orders_demo -c "
SELECT 'customers' AS tbl, COUNT(*) FROM customers
UNION ALL SELECT 'products', COUNT(*) FROM products
UNION ALL SELECT 'orders', COUNT(*) FROM orders
UNION ALL SELECT 'order_items', COUNT(*) FROM order_items;"
Expected output:
    tbl     | count
------------+--------
 customers  |  10000
 products   |    500
 orders     | 100000
 order_items| 300000
If you see all four tables with the expected row counts, the restore was successful.
Step 5 — Explore the Restored Database
Connect to the new database interactively:
psql -h <postgresql-fqdn> -U <pgadmin> -d orders_demo
5.1 — Confirm the tables exist
\dt
You should see four tables:
| Table | Description |
|---|---|
customers |
10,000 customer profiles with city, country, loyalty points |
products |
500 products across 5 categories |
orders |
100,000 orders over the past year with status and shipping info |
order_items |
300,000 line items linking orders to products |
5.2 — Inspect table structures
\d customers
\d products
\d orders
\d order_items
Pay attention to data types, primary keys, and whether any foreign key constraints exist.
5.3 — Check row counts
SELECT 'customers' AS table_name, COUNT(*) AS rows FROM customers
UNION ALL
SELECT 'products', COUNT(*) FROM products
UNION ALL
SELECT 'orders', COUNT(*) FROM orders
UNION ALL
SELECT 'order_items', COUNT(*) FROM order_items;
5.4 — Check table sizes
SELECT relname AS table_name,
       pg_size_pretty(pg_total_relation_size(oid)) AS total_size,
       pg_size_pretty(pg_relation_size(oid)) AS table_size,
       pg_size_pretty(pg_indexes_size(oid)) AS index_size
FROM pg_class
WHERE relname IN ('customers','products','orders','order_items')
ORDER BY pg_total_relation_size(oid) DESC;
5.5 — List indexes
\di
Note: You will see only primary-key indexes. There are no additional indexes on foreign keys or commonly queried columns — this is intentional. The demo queries in the next section rely on sequential scans to generate CPU load.
5.6 — Explore sample data
-- Peek at customers
SELECT * FROM customers LIMIT 5;

-- Product categories
SELECT category, COUNT(*) AS count FROM products GROUP BY category ORDER BY count DESC;

-- Order status distribution
SELECT status, COUNT(*) AS count FROM orders GROUP BY status ORDER BY count DESC;

-- Most recent orders
SELECT order_id, customer_id, order_date, total_amount, status
FROM orders ORDER BY order_date DESC LIMIT 10;

-- Average items per order
SELECT ROUND(AVG(item_count), 2) AS avg_items_per_order
FROM (SELECT order_id, COUNT(*) AS item_count FROM order_items GROUP BY order_id) sub;
5.7 — Check for missing indexes (useful diagnostic)
SELECT relname AS table,
       seq_scan, seq_tup_read,
       idx_scan, idx_tup_fetch,
       CASE WHEN seq_scan > 0
            THEN ROUND(seq_tup_read::numeric / seq_scan, 0)
            ELSE 0
       END AS avg_rows_per_seq_scan
FROM pg_stat_user_tables
ORDER BY seq_tup_read DESC;
This shows how many sequential scans vs. index scans each table has received. After running the workload queries in the next section, revisit this to see the impact.
Step 6 — Enable pg_stat_statements
pg_stat_statements tracks execution statistics for all SQL statements. It is required for Query Performance Insight in the Azure Portal and for the Monitoring and Index Tuning sections later in the workshop. Set it up now so it collects data from the start.
- Go to Azure Portal → your PostgreSQL server → Server parameters
- Search for
shared_preload_libraries→ ensure pg_stat_statements is checked - Search for
pg_stat_statements.track→ set to ALL - Click Save — this requires a server restart
After the restart, connect from the jumpbox and create the extension:
CREATE EXTENSION IF NOT EXISTS pg_stat_statements;
Verify it is working:
SELECT calls, query FROM pg_stat_statements LIMIT 5;
Run Demo Workload — Break Things on Purpose
In this section you will run a set of intentionally unoptimised, CPU-heavy queries against the orders_demo database you restored in the previous section. The goal is to generate realistic workload that you will observe in the Monitoring section and fix in the Index Tuning Lab.
Prerequisite: You should have the
orders_demodatabase restored from the Load Data section and be connected from the jumpbox.
Connect to the database if you are not already:
psql -h <postgresql-fqdn> -U <pgadmin> -d orders_demo
Step 1 — Run CPU-Heavy Demo Queries
Important: Enable timing first so you can see how long each query takes:
\timing
These queries are intentionally unoptimised — they trigger full sequential scans, large sorts, and heavy computation. This is exactly the kind of workload you will observe in the next section — Monitoring PostgreSQL with Azure Portal.
Query 1 — Full Cross-Join Aggregation (extreme CPU)
SELECT c.city, c.country, p.category,
       COUNT(DISTINCT o.order_id) AS total_orders,
       SUM(oi.quantity * oi.unit_price * (1 - oi.discount/100)) AS revenue
FROM customers c
JOIN orders o ON o.customer_id = c.customer_id
JOIN order_items oi ON oi.order_id = o.order_id
JOIN products p ON p.product_id = oi.product_id
GROUP BY c.city, c.country, p.category
ORDER BY revenue DESC;
Why it is heavy: This joins all four tables (10K × 100K × 300K × 500 rows of data in the pipeline) and groups by three columns. The COUNT(DISTINCT ...) forces a sort-based deduplication for every group. With no indexes on the join columns other than primary keys, the planner must do multiple sequential scans and hash joins, then a large sort for the ORDER BY.
Query 2 — Correlated Subquery (no index, sequential scans)
SELECT c.customer_id, c.first_name, c.last_name,
       (SELECT COUNT(*) FROM orders o WHERE o.customer_id = c.customer_id) AS order_count,
       (SELECT COALESCE(SUM(total_amount),0) FROM orders o WHERE o.customer_id = c.customer_id) AS lifetime_value
FROM customers c
ORDER BY lifetime_value DESC
LIMIT 100;
Why it is heavy: For each of the 10,000 customers, PostgreSQL executes two subqueries against the 100,000-row orders table. Without an index on orders.customer_id, each subquery triggers a full sequential scan — resulting in ~20,000 sequential scans of the orders table in total.
Query 3 — Window Functions Over Large Dataset (memory + CPU)
SELECT order_id, customer_id, order_date, total_amount,
       SUM(total_amount) OVER (PARTITION BY customer_id ORDER BY order_date) AS running_total,
       ROW_NUMBER() OVER (PARTITION BY customer_id ORDER BY total_amount DESC) AS rank_by_amount,
       AVG(total_amount) OVER (PARTITION BY shipping_country ORDER BY order_date ROWS BETWEEN 100 PRECEDING AND CURRENT ROW) AS moving_avg
FROM orders;
Why it is heavy: Three separate window functions each require sorting the full 100,000-row orders table by different partition/order keys. The running_total computes a cumulative sum per customer; rank_by_amount assigns a row number per customer by descending amount; moving_avg computes a sliding 101-row average across shipping countries. PostgreSQL may need to materialise intermediate sort results to temp files if work_mem is limited.
Query 4 — Heavy Text Computation + Sort (CPU + temp disk)
SELECT c.email, md5(c.email || o.order_id::TEXT) AS hash_key,
       string_agg(p.product_name, ', ' ORDER BY oi.unit_price DESC) AS products_bought
FROM customers c
JOIN orders o ON o.customer_id = c.customer_id
JOIN order_items oi ON oi.order_id = o.order_id
JOIN products p ON p.product_id = oi.product_id
GROUP BY c.email, o.order_id
ORDER BY hash_key;
Why it is heavy: The md5() function computes a hash for every row in the join result (~300,000 rows). string_agg(... ORDER BY ...) sorts product names within each group by descending price. The final ORDER BY hash_key sorts all ~100,000 result groups by a computed hash — the result is essentially random, which defeats any natural ordering and forces a full sort.
Query 5 — Repeated Sequential Scan Loop (sustained CPU for ~30s+)
DO $$
BEGIN
  FOR i IN 1..20 LOOP
    PERFORM COUNT(*) FROM orders o
    JOIN order_items oi ON oi.order_id = o.order_id
    WHERE md5(o.status || oi.quantity::TEXT) LIKE '00%';
  END LOOP;
END $$;
Why it is heavy: This PL/pgSQL anonymous block runs the same expensive query 20 times in a tight loop. Each iteration joins 100K orders with 300K order items, computes md5() on every joined row, and then filters by a text pattern. The LIKE '00%' filter on the hash cannot use any index, so every iteration is a full sequential scan + hash join + function evaluation. The result is sustained, constant CPU utilisation for tens of seconds.
Understanding the syntax:
| Element | What it does |
|---|---|
DO |
Executes an anonymous code block — like a one-off function you don’t need to save |
$$ ... $$ |
Dollar-quoted string delimiters — replaces single quotes so you don’t have to escape quotes inside the block |
BEGIN ... END |
Marks the start and end of the PL/pgSQL code block |
FOR i IN 1..20 LOOP |
Integer FOR loop — runs the body 20 times with i counting from 1 to 20 |
PERFORM |
Runs a SELECT but discards the result — used when you want the side effects (CPU load) but don’t need the output |
Tip: Increase the loop count to
50or100for longer sustained load:DO $$ BEGIN FOR i IN 1..100 LOOP PERFORM COUNT(*) FROM orders o JOIN order_items oi ON oi.order_id = o.order_id WHERE md5(o.status || oi.quantity::TEXT) LIKE '00%'; END LOOP; END $$;
Query 6 — Large Temp-Table Sort + Distinct (IOPS + memory pressure)
SELECT DISTINCT ON (customer_id)
customer_id, order_id, order_date, total_amount
FROM orders
ORDER BY customer_id, total_amount DESC, order_date DESC;
Why it is heavy: DISTINCT ON requires the result to be sorted by the grouping column (customer_id) and then by the tie-breaking columns (total_amount DESC, order_date DESC). This forces a full sort of all 100,000 orders. If the sort does not fit in work_mem, PostgreSQL spills to temp files on disk, creating I/O pressure.
Step 2 — Generate Maximum Load (Concurrent Execution)
For the best demonstration during monitoring exercises, run multiple queries at the same time from separate psql sessions.
Open three SSH sessions to the jumpbox, connect to orders_demo in each, then run:
| Session | Query | Why |
|---|---|---|
| Session 1 | Query 1 (cross-join aggregation) | Saturates one backend with multi-table joins |
| Session 2 | Query 3 (window functions) | Forces large sorts in another backend |
| Session 3 | Query 5 (loop × 50 or 100) | Sustained CPU from sequential scans |
Running these concurrently will show multiple active backends, high CPU utilisation, temp file usage, and sequential-scan-heavy workload in your monitoring dashboards.
Step 3 — Observe the Impact
After running the workload, check the damage:
Active queries
SELECT pid, state, query_start, LEFT(query, 80) AS query_snippet
FROM pg_stat_activity
WHERE datname = 'orders_demo' AND state != 'idle'
ORDER BY query_start;
Sequential scan statistics (revisit from the Load Data section)
SELECT relname AS table,
seq_scan, seq_tup_read,
idx_scan, idx_tup_fetch
FROM pg_stat_user_tables
ORDER BY seq_tup_read DESC;
How to read this output:
| Column | What it means | What to look for |
|---|---|---|
seq_scan |
Number of sequential (full table) scans since last stats reset | High on large tables = missing index. After the demo workload, orders should show thousands of seq_scans from Query 2 and 5 |
seq_tup_read |
Total rows read by sequential scans | The real cost indicator. Millions or billions = massive wasted I/O |
idx_scan |
Number of index scans | Should be much higher than seq_scan on large, frequently queried tables. If it is 0, no index is being used |
idx_tup_fetch |
Rows fetched via indexes | Each row was targeted — this is efficient. Compare to seq_tup_read: a large gap means most reads are wasteful full scans |
Rule of thumb: If
seq_tup_readis orders of magnitude larger thanidx_tup_fetchon a table, that table almost certainly needs an index on the columns used in WHERE/JOIN clauses. You will fix this in the Index Tuning Lab.
Temp file usage
SELECT datname, temp_files, pg_size_pretty(temp_bytes) AS temp_size
FROM pg_stat_database
WHERE datname = 'orders_demo';
How to read this output:
| Column | What it means | What to look for |
|---|---|---|
temp_files |
Number of temp files created since last stats reset | Any value > 0 means queries spilled sorts or hashes to disk because they exceeded work_mem |
temp_bytes |
Total bytes written to temp files | Large values (hundreds of MB+) indicate heavy sort/hash operations. Queries 3, 4, and 6 are the likely culprits |
Total database size
SELECT pg_size_pretty(pg_database_size('orders_demo')) AS db_size;
These statistics feed directly into the next section — Monitoring PostgreSQL with Azure Portal. Leave them as-is — do not reset the stats yet.
Monitoring PostgreSQL with Azure Portal
In the previous section you ran six heavy queries against the orders_demo database and generated concurrent load. Now you will use the Azure Portal to see exactly what those queries did to your server — CPU spikes, memory pressure, IOPS saturation, temp file spills, and long-running sessions.
By the end of this section you will be able to:
- Navigate the built-in metrics for Azure Database for PostgreSQL Flexible Server
- Correlate a metric spike to a specific query or behaviour
- Use Query Performance Insight to find the most expensive queries
- Configure an alert rule so you get notified before problems escalate
- Use diagnostic settings to send logs to Log Analytics for deeper analysis
Prerequisite: You should have run the demo workload from the Run Demo Workload section. The metrics and query stats shown here are generated by that workload. If you skipped it, go back and run at least Queries 1, 3, and 5 concurrently before continuing.
Step 1 — Open the Metrics Blade
- Go to the Azure Portal → your resource group → click your PostgreSQL Flexible Server
- In the left menu, under Monitoring, click Metrics
You will see a chart area with a dropdown to select metrics. This is Azure Monitor Metrics Explorer — it works the same way for all Azure resources, but the available metrics are specific to PostgreSQL.
Step 2 — Observe CPU Impact
2.1 — Add the CPU metric
- Click Add metric
- Metric namespace: leave default
- Metric: CPU percent
- Aggregation: Max
- Set the time range to Last 1 hour (top-right)
What to look for: You should see a clear spike corresponding to when you ran the concurrent workload (Queries 1, 3, and 5). If you ran Query 5 with a loop count of 50 or 100, you will see a sustained plateau at high CPU for the duration.
Link to the workload:
| Query | Why it caused CPU | What you see in the chart |
|---|---|---|
| Query 1 (cross-join aggregation) | Hash joins across 4 tables, COUNT(DISTINCT) forcing sort-based dedup | Sharp spike at start |
| Query 3 (window functions) | Three window functions each requiring a full sort of 100K rows | Overlapping spike with Query 1 |
| Query 5 (loop × 20–100) | Sustained sequential scans and md5() computation in a tight loop | Flat plateau at high CPU |
2.2 — Split by dimension (optional)
Click Apply splitting → split by None (Flexible Server doesn’t split CPU by backend, but this is useful for other metrics like connections).
Tip: Click the pin icon to pin this chart to a dashboard. When running workshops or demos, having a pre-built dashboard saves time.
Step 3 — Observe Memory Pressure
- Click Add metric (or start a new chart)
- Metric: Memory percent
- Aggregation: Max
What to look for: Memory spikes correlate with:
- Query 3 (window functions): PostgreSQL materialises sort results in memory. If
work_memis sufficient, you see a memory spike. If not, it spills to disk (you will see that in Step 5 instead). - Query 1 (hash joins): Each hash join builds an in-memory hash table.
Healthy range: < 75%. If you consistently see > 85%, the server SKU may be too small for the workload, or shared_buffers / work_mem are misconfigured.
Step 4 — Observe IOPS and Storage
Add these metrics to see storage behaviour:
| Metric | Aggregation | What it shows |
|---|---|---|
| Read IOPS | Max | Disk reads — high during sequential scans |
| Write IOPS | Max | Disk writes — high during sorts that spill, checkpoints |
| Read Throughput | Max | Bytes/sec read from storage |
| Write Throughput | Max | Bytes/sec written to storage |
| Storage percent | Max | How full the disk is |
Link to the workload:
| Query | Expected I/O pattern |
|---|---|
| Query 1 (cross-join) | High read IOPS — sequential scan of all 4 tables from disk |
| Query 4 (md5 + string_agg + sort) | High write IOPS — sorts spill to temp files |
| Query 5 (loop) | Sustained read IOPS — same tables scanned 20–100 times |
| Query 6 (DISTINCT ON + sort) | Spike in write IOPS if the sort exceeds work_mem |
Important: Azure Flexible Server has IOPS limits based on SKU and storage size. If your queries hit the IOPS ceiling, the server throttles I/O and queries slow down dramatically. You can see this by comparing Read IOPS against the provisioned IOPS limit shown in the Overview blade.
Step 5 — Observe Temp Files and Connections
These less obvious metrics reveal important performance details:
5.1 — Temp files
- Metric: Temp Files Size (under the PostgreSQL-specific metrics)
- Aggregation: Max
Temp files are created when PostgreSQL runs a sort or hash that exceeds work_mem. This is a direct signal that your queries are too heavy for the current work_mem setting.
Link to the workload:
- Query 3 (window functions: 3 sorts on 100K rows) — most likely temp file generator
- Query 4 (sort by computed hash) — random sort order forces spill
- Query 6 (DISTINCT ON with multi-column sort) — spills if table is larger than
work_mem
What to do about it: Increasing work_mem reduces temp file usage but increases memory consumption per-session. The trade-off is:
Higher work_mem → fewer temp files → faster sorts → more RAM per connection
Lower work_mem → more temp files → slower sorts → less RAM per connection
For 10 concurrent connections with work_mem = 64MB, PostgreSQL may use up to 640MB just for sorts.
5.2 — Active connections
- Metric: Active Connections
- Aggregation: Max
What to look for: When you ran 3 concurrent queries in Step 7 of the workload section, you should see active connections jump from 1 to 3 (or more). If connections spike beyond what you expect, it may indicate:
- Connection pooling is not configured (each app request opens a new connection)
- A connection leak (connections are opened but never closed)
Step 6 — Enable pg_stat_statements
pg_stat_statements is a standard PostgreSQL extension that collects per-query execution statistics (calls, time, rows). It works on any PostgreSQL installation and is the foundation for query performance analysis.
- Go to Server parameters in the left menu
- Allow the extension first:
- Search for
azure.extensions - Click the dropdown — this shows all extensions available on Flexible Server
- Find and check
pg_stat_statements - Click Save (this does not require a restart)
- Search for
- Now enable the extension in the server:
- Search for
shared_preload_librariesand ensurepg_stat_statementsis checked - Search for
pg_stat_statements.trackand set it toALL
- Search for
- Click Save — this requires a server restart
Already done? If you enabled
pg_stat_statementsin Step 6 of the Load Data section, skip to Step 7.
After the restart, connect from the jumpbox and create the extension:
CREATE EXTENSION IF NOT EXISTS pg_stat_statements;
Verify it’s working:
SELECT calls, total_exec_time, mean_exec_time, rows, LEFT(query, 100) AS query
FROM pg_stat_statements
ORDER BY total_exec_time DESC
LIMIT 10;
You should see the demo workload queries at the top of the list.
Step 7 — Configure Diagnostic Settings and Query Store (Logs to Log Analytics)
While Metrics Explorer shows numbers, diagnostic settings capture detailed logs including individual query executions, autovacuum runs, and connection events. This is also a prerequisite for Query Performance Insight (Step 8).
This step requires both Azure Query Store (server-side data collection) and diagnostic settings (export to Log Analytics). Query Store is an Azure-specific feature — it is separate from the standard pg_stat_statements extension configured in Step 6.
7.1 — Enable Query Store
- Go to Server parameters in the left menu
- Search for
pg_qs.query_capture_modeand set it to ALL (or TOP) - Search for
pgms_wait_sampling.query_capture_modeand set it to ALL - Click Save — this requires a server restart
| Parameter | Value | Why |
|---|---|---|
pg_qs.query_capture_mode |
ALL (or TOP) |
Enables Query Store — collects query runtime statistics that feed Query Performance Insight and the PostgreSQLQueryStoreRuntimeStatistics log category |
pgms_wait_sampling.query_capture_mode |
ALL |
Enables Query Store Wait Sampling — collects wait event data that feeds the PostgreSQLQueryStoreWaitStatistics log category |
Without these parameters, the diagnostic settings below will export empty log categories — and Query Performance Insight (Step 8) will show no data.
7.2 — Create a Log Analytics workspace (if you don’t have one)
az monitor log-analytics workspace create \
--resource-group <resource-group> \
--workspace-name pg-workshop-logs \
--location uksouth
7.3 — Enable diagnostic settings
- In the PostgreSQL server blade, click Diagnostic settings (under Monitoring)
- Click + Add diagnostic setting
- Name:
pg-logs - Check the log categories:
- PostgreSQL Sessions — connection/disconnection events
- PostgreSQL Query Store Runtime — query execution statistics
- PostgreSQL Query Store Wait Statistics — what queries waited on
- Check AllMetrics
- Destination: Send to Log Analytics workspace → select
pg-workshop-logs - Click Save
Logs take 5–10 minutes to start appearing in Log Analytics. Re-run a few demo workload queries to generate fresh data while you wait.
7.4 — Verify data is flowing
Before running any analytical queries, confirm that logs are arriving in your Log Analytics workspace. Go to your Log Analytics workspace → Logs and run:
AzureDiagnostics
| where ResourceProvider == "MICROSOFT.DBFORPOSTGRESQL"
| summarize count() by Category
You should see categories including PostgreSQLQueryStoreRuntimeStatistics, PostgreSQLQueryStoreWaitStatistics, and PostgreSQLSessions. If this returns no results, check that: (1) diagnostic settings in Step 7.2 are saved and pointing to this workspace, (2) Query Store is enabled in Step 7.1, (3) you’ve waited at least 5–10 minutes.
7.5 — Query the logs with KQL
Go to your Log Analytics workspace → Logs. Try these queries:
Slow queries (> 5 seconds):
AzureDiagnostics
| where ResourceProvider == "MICROSOFT.DBFORPOSTGRESQL"
| where Category == "PostgreSQLQueryStoreRuntimeStatistics"
| where mean_time_d > 5
| project TimeGenerated, db_name_s, query_id_d, calls_d, mean_time_d, total_time_d
| order by total_time_d desc
| take 20
Connection events:
AzureDiagnostics
| where ResourceProvider == "MICROSOFT.DBFORPOSTGRESQL"
| where Category == "PostgreSQLSessions"
| project TimeGenerated, event_s, user_s, client_ip_s, db_name_s
| order by TimeGenerated desc
| take 50
Wait events (what are queries waiting on):
AzureDiagnostics
| where ResourceProvider == "MICROSOFT.DBFORPOSTGRESQL"
| where Category == "PostgreSQLQueryStoreWaitStatistics"
| summarize total_wait_ms = sum(total_time_d * 1000) by event_s, query_id_d
| order by total_wait_ms desc
| take 20
No results? If the KQL queries return empty, verify: (1)
pg_qs.query_capture_modeis set toALLorTOPin Step 7.1, (2) diagnostic settings in Step 7.3 include the Query Store log categories, (3) you’ve waited at least 5–10 minutes after configuration.
Step 8 — Query Performance Insight
This is the most powerful built-in tool for finding slow queries without installing any extensions.
Prerequisites: Step 7 must be completed first. Query Performance Insight requires Query Store (
pg_qs.query_capture_mode), Query Store Wait Sampling (pgms_wait_sampling.query_capture_mode), and a Log Analytics workspace with diagnostic settings configured. See the official prerequisites.
- In the left menu, under Intelligent Performance, click Query Performance Insight
- You will see tabs: Long running queries, Top queries by CPU, Top queries by IO
8.1 — Long running queries
This tab shows queries that took the longest wall-clock time. After the demo workload, you should see:
| Expected query | Why it appears here |
|---|---|
| Query 5 (DO $$ loop) | Ran for 30+ seconds |
| Query 1 (cross-join aggregation) | Multi-table join with aggregation |
| Query 3 (window functions) | Three sorts on 100K rows |
Note: Query Performance Insight normalises queries — it replaces literal values with
$1,$2placeholders so identical queries with different parameters are grouped together. TheDO $$ ... $$block appears as a single query.
8.2 — Top queries by CPU
Switch to the CPU tab. This shows queries ranked by total CPU time consumed.
Expected top entries after the workload:
| Rank | Query | Why |
|---|---|---|
| 1 | Query 5 (loop) | md5() computed on 300K rows × 20–100 iterations |
| 2 | Query 1 (cross-join) | Hash joins + COUNT(DISTINCT) + final sort |
| 3 | Query 4 (md5 + string_agg) | md5() on every row + string_agg with internal sort |
8.3 — Top queries by IO
Switch to the IO tab. This ranks queries by blocks read from storage.
Expected top entries:
| Rank | Query | Why |
|---|---|---|
| 1 | Query 5 (loop) | Sequential scan of orders + order_items × 20–100 times |
| 2 | Query 2 (correlated subquery) | ~20,000 sequential scans of orders |
| 3 | Query 1 (cross-join) | Full scan of all 4 tables |
Tip: Click on any query bar to see the full query text and its execution timeline.
Step 9 — Create an Alert Rule
Set up an alert so you are notified when CPU exceeds a threshold — this simulates a production monitoring setup.
9.1 — Create the alert
- In the PostgreSQL server blade → Alerts (under Monitoring)
- Click + Create → Alert rule
- Condition:
- Signal: CPU percent
- Operator: Greater than
- Threshold: 80
- Aggregation type: Maximum
- Aggregation granularity: 5 minutes
- Frequency of evaluation: 1 minute
- Click Next: Actions
9.2 — Create an action group
- Click + Create action group
- Name:
workshop-alerts - Notification type: Email/SMS/Push/Voice
- Enter your email address
- Click Review + create → Create
9.3 — Complete the alert rule
- Alert rule name:
High CPU Alert - Severity: 2 - Warning
- Click Review + create → Create
9.4 — Test the alert
Go back to the jumpbox and re-run Query 5 with a higher loop count:
\c orders_demo
DO $$
BEGIN
  FOR i IN 1..100 LOOP
    PERFORM COUNT(*) FROM orders o
    JOIN order_items oi ON oi.order_id = o.order_id
    WHERE md5(o.status || oi.quantity::TEXT) LIKE '00%';
  END LOOP;
END $$;
Within a few minutes, you should receive an email alert that CPU exceeded 80%.
Clean up: After testing, you can disable the alert rule to avoid further notifications. Go to Alerts → Alert rules → click the rule → Disable.
Step 10 — Correlating Metrics to Queries (Summary)
This is the key skill — when you see a metric spike in the portal, how do you trace it back to a specific query?

Here is how each demo query maps to the metrics you observed:
| Query | CPU | Memory | Read IOPS | Write IOPS | Temp Files | Root Cause |
|---|---|---|---|---|---|---|
| Q1 — Cross-join aggregation | High | Medium | High | Low | Low | No indexes on FK columns → sequential scans + hash joins |
| Q2 — Correlated subquery | High | Low | Very High | Low | Low | No index on orders.customer_id → 20K sequential scans |
| Q3 — Window functions | High | High | Medium | Medium–High | High | Three sorts on 100K rows → memory pressure → temp file spill |
| Q4 — md5 + string_agg | Medium | Medium | High | Medium | Medium | Per-row function evaluation + sort by computed value |
| Q5 — Loop × 20–100 | Very High | Low | Very High | Low | Low | Sustained CPU: same expensive query in tight loop |
| Q6 — DISTINCT ON + sort | Medium | Medium | Medium | Medium | Medium | Full sort of 100K rows → temp file if work_mem too low |
Step 11 — Azure Monitor Workbooks (Optional — Instructor Demo)
Azure provides pre-built Workbooks for PostgreSQL that combine multiple metrics and logs into a single dashboard.
- In the PostgreSQL blade → Workbooks (under Monitoring)
- Browse the gallery — look for:
- PostgreSQL Flexible Server Overview — CPU, memory, connections, IOPS in one view
- Query Performance — visualises
pg_stat_statementsdata over time
- Click on a workbook to open it. You can filter by time range and server instance.
When to use Workbooks vs. Metrics Explorer:
- Metrics Explorer — ad-hoc investigation, “what is happening right now”
- Workbooks — pre-built dashboards for ongoing monitoring, good for handoff to ops teams
- Query Performance Insight — developer-focused, “which query is the problem”
- Log Analytics (KQL) — deepest level, cross-correlate logs with metrics, custom alerting
Step 12 — Recommended Server Parameters for Monitoring
Before leaving this section, verify these server parameters are enabled. They control what telemetry PostgreSQL and Azure collect:
- Go to Server parameters in the portal
- Search for and verify each parameter:
Azure-Specific Parameters (Flexible Server only)
These parameters are unique to Azure Database for PostgreSQL — Flexible Server and feed data into Azure Monitor. They do not exist in community PostgreSQL.
| Parameter | Recommended value | Why |
|---|---|---|
metrics.collector_database_activity |
on |
Enables Enhanced Metrics — per-database activity counters (transactions/sec, tuples inserted/updated/deleted, session counts) in Azure Monitor. Dynamic — no restart needed |
metrics.autovacuum_diagnostics |
on |
Surfaces autovacuum performance metrics (tables processed, duration, dead-tuple removal rate) in Azure Monitor so you can track vacuum health without parsing logs |
Standard PostgreSQL Parameters
These are community PostgreSQL parameters that work on any PostgreSQL installation. They control internal statistics collection and logging.
| Parameter | Recommended value | Why |
|---|---|---|
track_io_timing |
on |
Enables I/O timing in pg_stat_activity and EXPLAIN (BUFFERS) |
track_activities |
on |
Required for pg_stat_activity to show current queries |
track_counts |
on |
Required for pg_stat_user_tables counters (vacuum, scans) |
pg_stat_statements.track |
all |
Track queries in all contexts (top-level + nested) |
log_min_duration_statement |
5000 |
Log any query taking > 5 seconds to the PostgreSQL log |
log_checkpoints |
on |
Log checkpoint start/end with timing — helps diagnose I/O spikes |
log_connections |
on |
Log each new connection — helps detect connection storms |
log_disconnections |
on |
Log disconnections with session duration |
log_temp_files |
0 |
Log every temp file creation (value is minimum size in KB; 0 = all) |
log_autovacuum_min_duration |
0 |
Log every autovacuum run — essential for vacuum monitoring |
log_lock_waits |
on |
Log when a session waits longer than deadlock_timeout for a lock |
Note: Changing
shared_preload_librariesrequires a server restart. All other parameters above can be applied dynamically.
What You Learned
In this section you:
- Observed CPU, memory, IOPS, and temp file metrics in Azure Metrics Explorer and correlated each spike to a specific demo query
- Enabled
pg_stat_statementsto collect per-query execution statistics (standard PostgreSQL) - Configured Query Store and diagnostic settings to send PostgreSQL logs to Log Analytics and wrote KQL queries to analyse them
- Used Query Performance Insight to identify the top queries by CPU consumption and I/O without needing SSH access to the server
- Created an alert rule that sends a notification when CPU exceeds a threshold
- Learned the triage workflow: Metric spike → timestamp → Query Performance Insight → EXPLAIN ANALYZE → fix → verify
These skills apply directly to production operations. The demo workload intentionally created the same problems you will see in real applications — missing indexes, sequential scans, temp file spills, and sustained CPU from poorly written queries. The next sections (Database Profiling, MVCC, Statistics & Query Planning) will teach you to diagnose and fix these problems from the PostgreSQL side.
Administration & Access Control
Managing PostgreSQL DB
Note: The Azure Portal is updated frequently. Screenshots in this section may look slightly different from what you see, but the functionality and steps are the same — you will be able to perform all tasks described here.
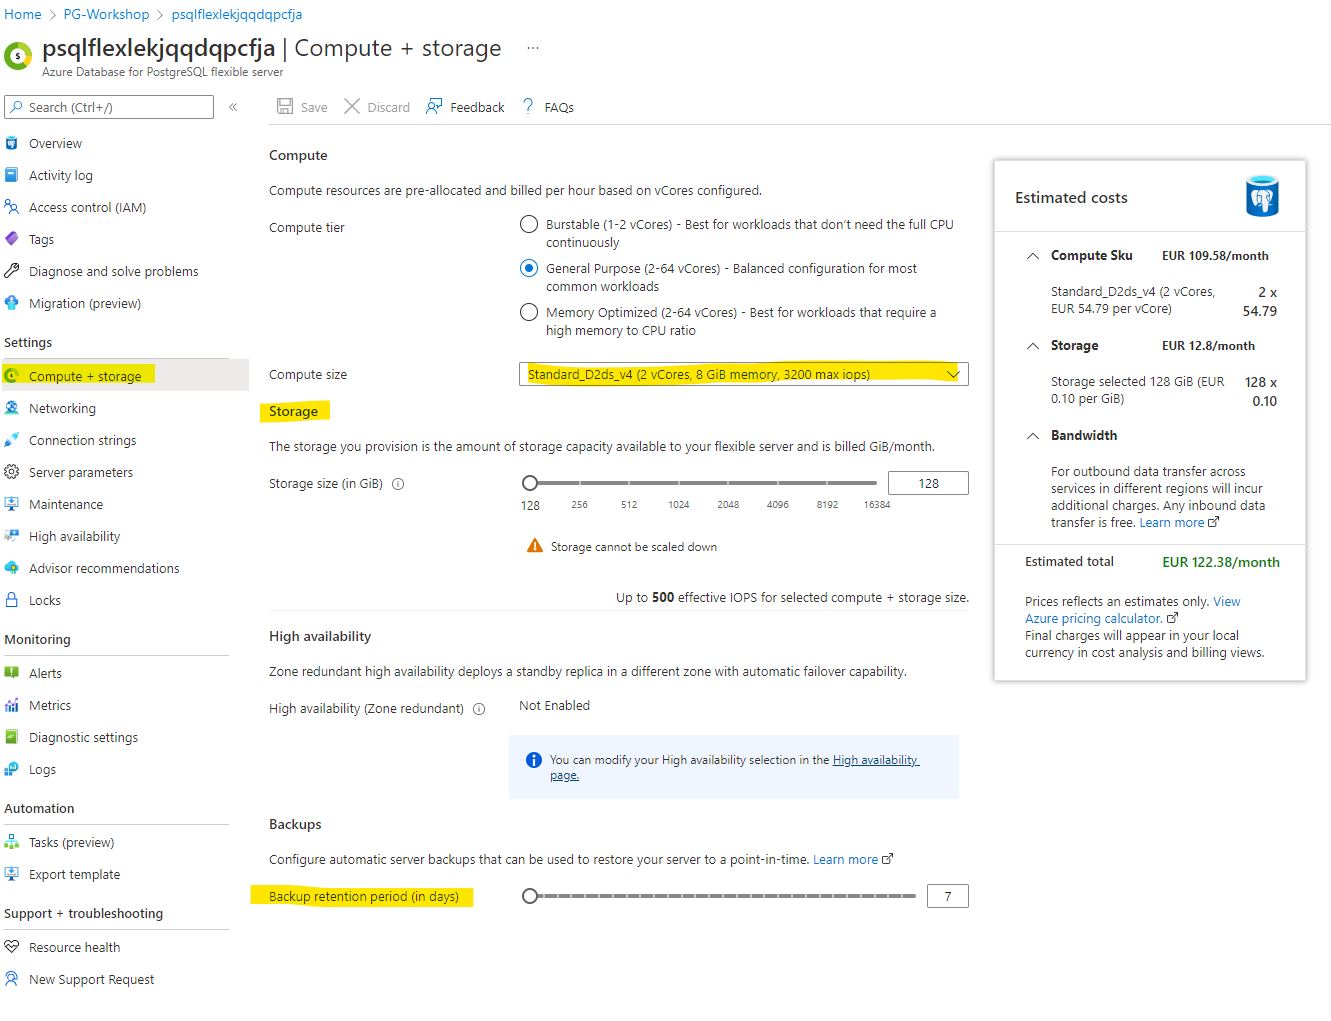
Managing Compute and Storage
Navigate to Compute + Storage to alter storage and compute settings. You can also change the backup retention period here.
Note: Increasing the compute size may incur additional costs. Only adjust if necessary.
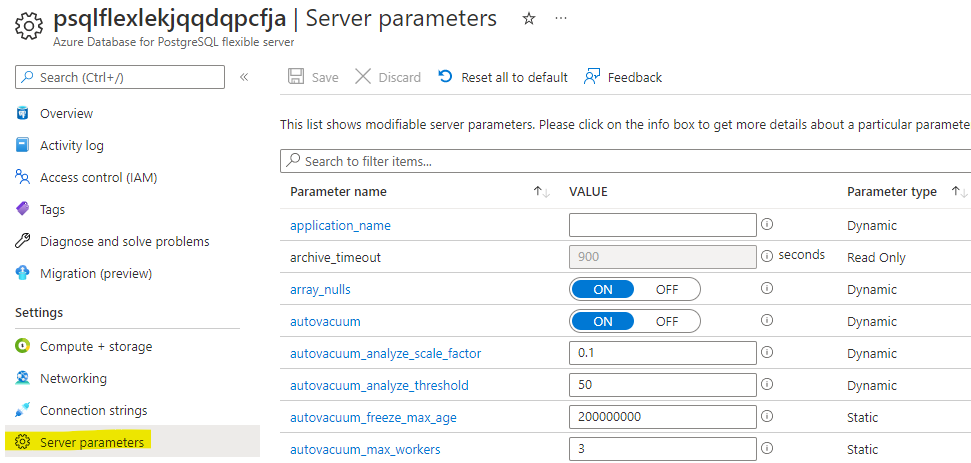
Managing Server Parameters
PostgreSQL’s behaviour is controlled by hundreds of server parameters (also called GUCs — Grand Unified Configuration). These control everything from memory allocation (shared_buffers, work_mem) to query planning (random_page_cost), logging (log_min_duration_statement), replication, autovacuum thresholds, and more.
In a self-managed PostgreSQL installation, you would edit postgresql.conf directly. On Azure Database for PostgreSQL Flexible Server, you do not have access to configuration files. Instead, you manage parameters through the Azure Portal (Server parameters blade) or via the Azure CLI / REST API.
Changes made in the portal apply as the server-level default — they affect all databases, roles, and sessions unless overridden at a lower level.
Parameter types: Dynamic, Static, and Read-Only
Not all parameters behave the same way when you change them:
| Type | Behaviour | Examples |
|---|---|---|
| Dynamic | Takes effect immediately — no restart needed | work_mem, log_min_duration_statement, statement_timeout |
| Static | Requires a server restart to take effect. The portal will prompt you to restart after saving. | shared_buffers, shared_preload_libraries, max_connections |
| Read-only | Managed by Azure — you cannot change these. They are set based on your SKU and storage tier. | max_locks_per_transaction, block_size |
Tip: In the portal, the Server parameters blade shows a note next to each parameter indicating whether it is dynamic or requires a restart.
Scope levels
You can override the server-level default at narrower scopes. Each level inherits from the one above unless explicitly overridden:
| Scope | How to set | Lifetime | Use case |
|---|---|---|---|
| Server (global default) | Azure Portal / CLI | Persists across restarts | Baseline configuration for all workloads |
| Database | ALTER DATABASE dbname SET param = value; |
Persists — applies to all sessions in that database | Different work_mem for an analytics DB vs. OLTP DB |
| Role | ALTER ROLE username SET param = value; |
Persists — applies whenever that role connects | Higher statement_timeout for a batch-processing role |
| Session | SET param = value; |
Current session only — lost on disconnect | Temporary tuning for a specific query or script |
To check the current effective value of any parameter in your session:
SHOW work_mem;
To see all non-default parameter values:
SELECT name, setting, source
FROM pg_settings
WHERE source != 'default'
ORDER BY name;
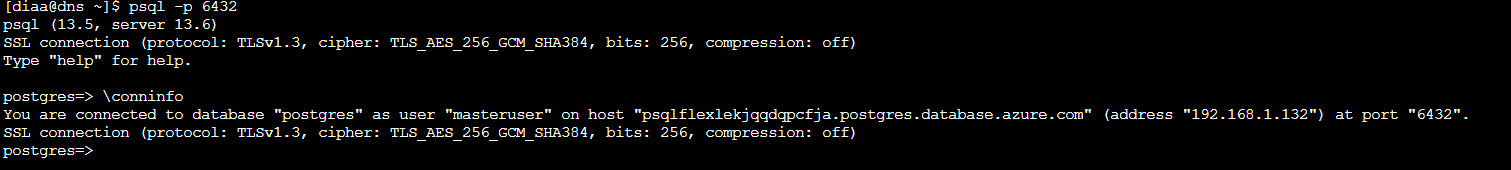
To enable PgBouncer, type pgbouncer in the search box and set its value to TRUE:
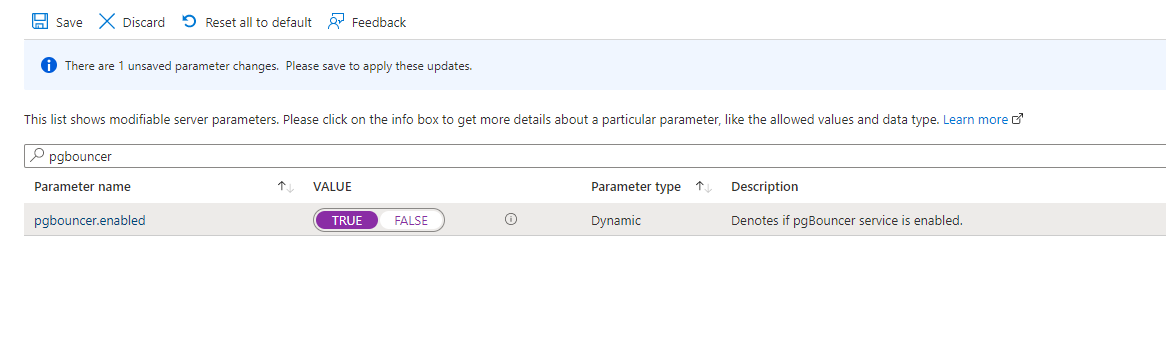
Click Save and wait for the deployment to complete successfully:
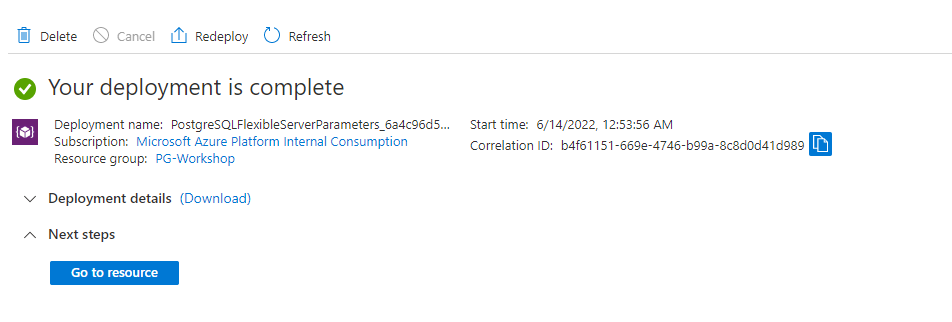
Once you see the success screen, access PostgreSQL through port 6432 on your VM:
psql -p 6432
Want to go deeper? For pool modes,
pgbenchload testing, and PgBouncer monitoring commands, see Connection Pooling with PgBouncer.
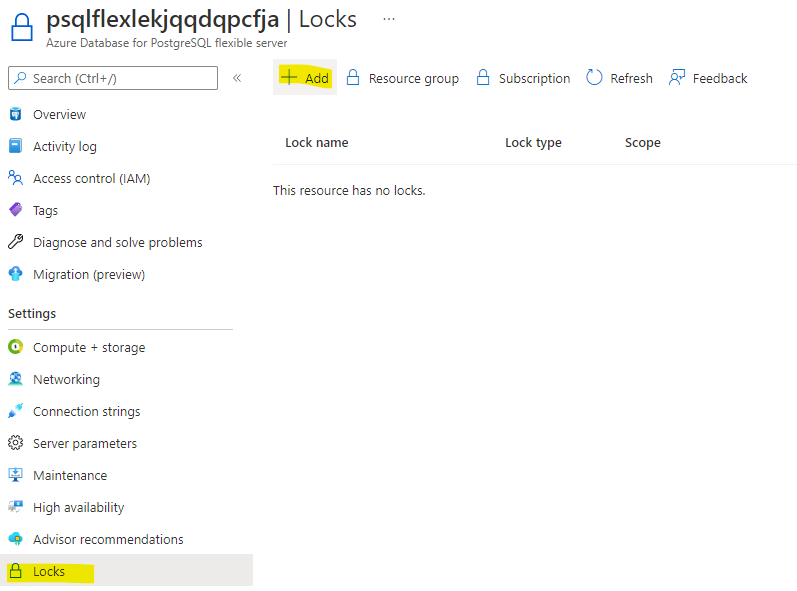
Applying Server Locks
Navigate to Locks:
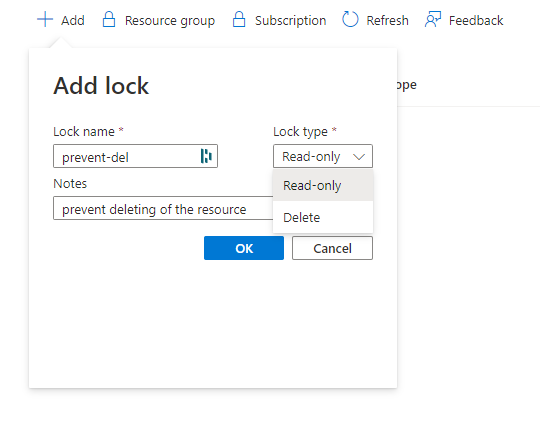
Click +Add, enter a lock name of your choice, and select the lock type Delete:
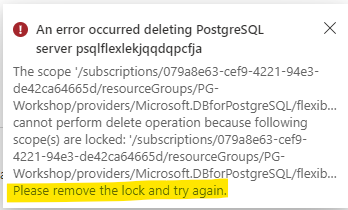
If you attempt to delete the server, you should see an error similar to the following:
Roles and Permissions
In this section you will learn how PostgreSQL manages access control through its role system — creating roles, granting privileges, understanding inheritance, and applying least-privilege principles.
Prerequisite: You should have the
orders_demodatabase restored from the Load Data section.
What You Will Build
By the end of this lab you will have built a complete access model for the orders_demo database with three different user profiles, each demonstrating a different security pattern.
Why this matters: In production, you should never give every user the admin credentials you created during deployment. Instead, create group roles that hold privileges, then assign users to those groups. This is the same principle as Active Directory groups or IAM roles — but implemented at the PostgreSQL level.
| Who | Role chain | Behaviour | Real-world scenario |
|---|---|---|---|
| dev_user | dev_user → app_team (INHERIT) |
Connects and immediately has read/write access | Application service account, backend developer |
| analyst_user | analyst_user → readonly (INHERIT) |
Connects and immediately has SELECT-only access | BI analyst, reporting dashboard, read replica user |
| contractor_user | contractor_user → app_team (NOINHERIT) |
Connects with no privileges — must SET ROLE to elevate |
External contractor, break-glass admin, audited access |
Key concepts you will practice:
- Roles are the only access object — PostgreSQL has no separate “users” and “groups.” Everything is a role.
CREATE USERis just an alias forCREATE ROLE ... LOGIN. - INHERIT vs NOINHERIT — controls whether a member automatically gets the parent role’s privileges (like a normal group) or must explicitly activate them (like
sudo). - Privilege codes — the compact letter codes (
r,a,w,d,D,x,t) that PostgreSQL uses to represent SELECT, INSERT, UPDATE, DELETE, TRUNCATE, REFERENCES, and TRIGGER. - Default privileges — ensuring future tables get the right grants automatically, not just tables that exist today.
- Schema isolation — revoking the overly permissive default on the
publicschema.
The access model is split into three paths — one per user profile:
1) app_team path (dev_user)

Value by step:
- Establishes a controlled admin starting point for governance.
- Centralizes write permissions in one reusable group role.
- Connects a real user to the role with automatic inheritance.
- Delivers immediate app productivity without manual role switching.
Real-world scenario: Application service accounts, backend developers — anyone who needs read/write access and should get it automatically on connect.
2) analyst_user path (readonly)

Value by step:
- Keeps role creation in a single trusted admin workflow.
- Encapsulates reporting permissions as SELECT-only.
- Grants analysts safe default access through inheritance.
- Prevents accidental writes while enabling BI/reporting use cases.
Real-world scenario: BI analysts, reporting dashboards, read replica users — anyone who should see data but never modify it.
3) contractor_user path (NOINHERIT)

Value by step:
- Defines a privileged role, but does not expose it by default.
- Associates contractor identity with explicit guardrails (
NOINHERIT). - Starts each session in low-privilege mode to reduce blast radius.
- Requires intentional elevation (
SET ROLE) for controlled operations. - Enables temporary write capability with full operator intent.
Real-world scenario: External contractors, break-glass admin accounts, audited access — anyone who can have elevated access but must consciously activate it each time.
Understanding Roles in PostgreSQL
PostgreSQL has a single concept for managing access: the role. There are no separate “users” and “groups” — everything is a role. The CREATE USER and CREATE GROUP commands are just convenience aliases:
| Command | What it actually does |
|---|---|
CREATE ROLE app_role; |
Creates a role that cannot login by default |
CREATE USER app_user; |
Same as CREATE ROLE app_user LOGIN; — adds login capability |
CREATE GROUP app_group; |
Same as CREATE ROLE app_group; — deprecated alias |
This is fundamentally different from Oracle (where users and roles are distinct objects) and SQL Server (where logins, users, and roles are separate layers).

Quick comparison for customers:
- PostgreSQL: one role object type;
LOGINandNOLOGINdefine behavior; membership + INHERIT control access. - Oracle: users and roles are separate objects; privileges can be direct or via role.
- SQL Server: login is server-level, user is database-level, roles are assigned per database.
Azure Flexible Server Role Hierarchy
On Azure Database for PostgreSQL Flexible Server, the admin user you created during deployment is not a superuser. Instead, it is a member of the azure_pg_admin role, which has most — but not all — superuser privileges.
Connect to the server from the jumpbox:
psql -h <postgresql-fqdn> -U <pgadmin> -d orders_demo
View the existing roles:
\du
You will see something like:
List of roles
Role name | Attributes | Member of
------------------+------------------------------------------------------------+------------------
azure_pg_admin | Create role, Create DB, Bypass RLS, Replication | {}
<your-admin> | Create role, Create DB | {azure_pg_admin}
azuresu | Superuser, Create role, Create DB, Replication, Bypass RLS | {}
Key points:
azuresu— the true superuser, managed by Azure. You cannot use this role.azure_pg_admin— the highest role available to you. Your admin user is a member of this role.<your-admin>— your admin user. It can create roles, create databases, and grant privileges, but it cannot load extensions that require superuser or access the file system.
Step 1 — Create Application Roles
A good practice is to create a group role (cannot login) that holds privileges, then add login roles (users) as members.
-- Create a group role for the application team
CREATE ROLE app_team NOLOGIN;
-- Create a read-only role
CREATE ROLE readonly NOLOGIN;
Now create two users and assign them to roles:
-- Developer: inherits app_team privileges automatically
CREATE ROLE dev_user LOGIN PASSWORD 'Workshop#Dev1' IN ROLE app_team INHERIT;
-- Analyst: inherits readonly privileges automatically
CREATE ROLE analyst_user LOGIN PASSWORD 'Workshop#Read1' IN ROLE readonly INHERIT;
-- Contractor: member of app_team but does NOT inherit privileges automatically
CREATE ROLE contractor_user LOGIN PASSWORD 'Workshop#Ext1' IN ROLE app_team NOINHERIT CONNECTION LIMIT 2;
Verify the roles:
\du
Role name | Attributes | Member of
---------------------+-------------------------------------------------+------------------
analyst_user | | {readonly}
app_team | Cannot login | {}
contractor_user | No inheritance, 2 connections | {app_team}
dev_user | | {app_team}
readonly | Cannot login | {}
Step 2 — Grant Privileges on the orders_demo Database
You should already be connected to the orders_demo database. If not:
\c orders_demo
Grant privileges to each group role:
-- app_team gets full access to all tables and sequences in public
GRANT USAGE ON SCHEMA public TO app_team;
GRANT ALL ON ALL TABLES IN SCHEMA public TO app_team;
GRANT ALL ON ALL SEQUENCES IN SCHEMA public TO app_team;
-- readonly gets SELECT only
GRANT USAGE ON SCHEMA public TO readonly;
GRANT SELECT ON ALL TABLES IN SCHEMA public TO readonly;
Why GRANT USAGE ON SCHEMA? In PostgreSQL, even if you have table-level privileges, you also need
USAGEon the schema that contains the table. This is a common gotcha for people coming from Oracle or SQL Server where schema access works differently.
Step 3 — Test INHERIT vs NOINHERIT
This is the most important concept in this section. Use SET ROLE to impersonate each user and see the difference.
First, grant yourself the ability to switch to these roles:
-- Run as your admin user
GRANT dev_user TO <your-admin>;
GRANT analyst_user TO <your-admin>;
GRANT contractor_user TO <your-admin>;
Test dev_user (INHERIT):
SET ROLE dev_user;
-- This should work — dev_user inherits app_team privileges
SELECT customer_id, first_name, last_name, email FROM customers LIMIT 5;
-- This should also work — app_team has ALL privileges
INSERT INTO customers (first_name, last_name, email, city, country)
VALUES ('Test', 'User', 'test@workshop.dev', 'London', 'United Kingdom');
-- Switch back
RESET ROLE;
Test analyst_user (INHERIT, readonly):
SET ROLE analyst_user;
-- SELECT works — analyst_user inherits readonly privileges
SELECT status, COUNT(*) FROM orders GROUP BY status;
-- INSERT fails — readonly only has SELECT
INSERT INTO customers (first_name, last_name, email, city, country)
VALUES ('Bad', 'Insert', 'nope@fail.dev', 'London', 'United Kingdom');
-- ERROR: permission denied for table customers
RESET ROLE;
Test contractor_user (NOINHERIT):
SET ROLE contractor_user;
-- This FAILS — contractor_user does NOT inherit app_team privileges
SELECT * FROM customers LIMIT 1;
-- ERROR: permission denied for table customers
Why? contractor_user was created with NOINHERIT. Even though it is a member of app_team, it does not automatically receive app_team’s privileges. The user must explicitly activate the role:
-- Explicitly activate the parent role
SET ROLE app_team;
-- Now it works
SELECT * FROM customers LIMIT 5;
RESET ROLE;
When to use NOINHERIT: For users who should have access but must consciously “elevate” to use it — similar to sudo on Linux or runas on Windows. Useful for contractors, automated accounts, or break-glass scenarios.

Step 4 — View and Read Privilege Codes
Run the following to see all granted privileges:
RESET ROLE;
\dp
You will see output like:
Access privileges
Schema | Name | Type | Access privileges | ...
--------+--------------+-------+--------------------------------+
public | customers | table | <admin>=arwdDxt/<admin> +|
| | | app_team=arwdDxt/<admin> +|
| | | readonly=r/<admin> |
public | orders | table | <admin>=arwdDxt/<admin> +|
| | | app_team=arwdDxt/<admin> +|
| | | readonly=r/<admin> |
public | order_items | table | <admin>=arwdDxt/<admin> +|
| | | app_team=arwdDxt/<admin> +|
| | | readonly=r/<admin> |
public | products | table | <admin>=arwdDxt/<admin> +|
| | | app_team=arwdDxt/<admin> +|
| | | readonly=r/<admin> |
Reading the privilege codes:
| Code | Privilege | Applies to |
|---|---|---|
r |
SELECT (read) | Tables, views |
a |
INSERT (append) | Tables |
w |
UPDATE (write) | Tables |
d |
DELETE | Tables |
D |
TRUNCATE | Tables |
x |
REFERENCES | Tables (foreign keys) |
t |
TRIGGER | Tables |
U |
USAGE | Schemas, sequences |
C |
CREATE | Schemas, databases |
c |
CONNECT | Databases |
T |
TEMPORARY | Databases |
The format is role=privileges/grantor. So app_team=arwdDxt/<admin> means: app_team has SELECT, INSERT, UPDATE, DELETE, TRUNCATE, REFERENCES, and TRIGGER on this table, granted by your admin user.
Step 5 — REVOKE Privileges
A realistic scenario: the orders table holds financial data and should be read-only for the application team. Remove INSERT/UPDATE/DELETE from app_team on orders, keeping only SELECT:
REVOKE INSERT, UPDATE, DELETE ON TABLE orders FROM app_team;
Verify:
SET ROLE dev_user;
-- SELECT still works
SELECT order_id, customer_id, total_amount, status FROM orders LIMIT 5;
-- INSERT now fails — orders is protected
INSERT INTO orders (customer_id, order_date, total_amount, status)
VALUES (1, now(), 99.99, 'pending');
-- ERROR: permission denied for table orders
-- But other tables still allow writes
INSERT INTO customers (first_name, last_name, email, city, country)
VALUES ('Another', 'Test', 'another@workshop.dev', 'Dublin', 'Ireland');
RESET ROLE;
Check the privilege codes again:
\dp orders
You should see app_team=rDxt/<admin> — the a, w, and d codes are gone.
Step 6 — Default Privileges for Future Tables
The GRANT ALL ON ALL TABLES command only affects tables that already exist. If you create a new table later, the grants are not applied automatically. This catches many people by surprise.
Fix this with ALTER DEFAULT PRIVILEGES:
-- Any future table created by your admin in the public schema
-- will automatically grant SELECT to readonly and ALL to app_team
ALTER DEFAULT PRIVILEGES IN SCHEMA public
GRANT SELECT ON TABLES TO readonly;
ALTER DEFAULT PRIVILEGES IN SCHEMA public
GRANT ALL ON TABLES TO app_team;
Test it:
-- Create a new table
CREATE TABLE test_defaults (id serial, name text);
-- Check privileges — readonly and app_team should already have access
\dp test_defaults
You should see readonly=r/<admin> and app_team=arwdDxt/<admin> without any explicit GRANT.
Clean up:
DROP TABLE test_defaults;
Step 7 — Schema-Level Isolation
For a more realistic setup, create a separate schema for the application and restrict the public schema:
-- Create an application schema
CREATE SCHEMA app AUTHORIZATION app_team;
-- Revoke default public access (PostgreSQL grants USAGE + CREATE on public to everyone by default)
REVOKE CREATE ON SCHEMA public FROM PUBLIC;
About the
PUBLICkeyword: In PostgreSQL,PUBLIC(all-caps in GRANT/REVOKE context) means “every role.” By default, every role hasUSAGEandCREATEon thepublicschema — this is a well-known security concern. RevokingCREATEfromPUBLICis a recommended hardening step.
Step 8 — Verify Permissions Work End-to-End
Open a new psql session as dev_user to verify everything works without SET ROLE:
# On the jumpbox, open a new connection
psql -h <postgresql-fqdn> -U dev_user -d orders_demo
-- Should work (inherited from app_team)
SELECT COUNT(*) FROM customers;
-- Should fail (we revoked INSERT on orders from app_team in Step 5)
INSERT INTO orders (customer_id, order_date, total_amount, status)
VALUES (1, now(), 49.99, 'pending');
-- ERROR: permission denied for table orders
\q
Step 9 — Clean Up Roles
Switch back to your admin user and clean up:
psql -h <postgresql-fqdn> -U <pgadmin> -d orders_demo
-- Revoke privileges first (required before dropping roles)
REVOKE ALL ON ALL TABLES IN SCHEMA public FROM app_team;
REVOKE ALL ON ALL TABLES IN SCHEMA public FROM readonly;
REVOKE ALL ON ALL SEQUENCES IN SCHEMA public FROM app_team;
REVOKE USAGE ON SCHEMA public FROM app_team;
REVOKE USAGE ON SCHEMA public FROM readonly;
-- Re-grant CREATE on public schema (we revoked it in Step 7)
GRANT CREATE ON SCHEMA public TO PUBLIC;
-- Remove default privilege changes from Step 6
ALTER DEFAULT PRIVILEGES IN SCHEMA public
REVOKE SELECT ON TABLES FROM readonly;
ALTER DEFAULT PRIVILEGES IN SCHEMA public
REVOKE ALL ON TABLES FROM app_team;
-- Re-grant INSERT/UPDATE/DELETE on orders (we revoked in Step 5)
-- Not strictly needed since we're dropping the roles, but good practice
GRANT ALL ON ALL TABLES IN SCHEMA public TO <your-admin>;
-- Drop the schema we created
DROP SCHEMA IF EXISTS app;
-- Drop users first, then group roles
DROP ROLE IF EXISTS dev_user;
DROP ROLE IF EXISTS analyst_user;
DROP ROLE IF EXISTS contractor_user;
DROP ROLE IF EXISTS app_team;
DROP ROLE IF EXISTS readonly;
-- Remove the test rows we inserted during the lab
DELETE FROM customers WHERE email IN ('test@workshop.dev', 'another@workshop.dev');
Summary
| Concept | What you learned |
|---|---|
| Roles | PostgreSQL has one concept: roles. CREATE USER = CREATE ROLE ... LOGIN. No separate users/groups. |
| INHERIT vs NOINHERIT | INHERIT = automatic privilege access. NOINHERIT = must explicitly SET ROLE to activate. |
| Privilege codes | r=SELECT, a=INSERT, w=UPDATE, d=DELETE, D=TRUNCATE, x=REFERENCES, t=TRIGGER |
| GRANT / REVOKE | Grant to group roles, not individual users. Revoke to remove specific privileges. |
| Default privileges | ALTER DEFAULT PRIVILEGES ensures future tables get the right grants automatically. |
| Schema isolation | Revoke CREATE on public from PUBLIC. Use dedicated schemas per application. |
| Azure specifics | Your admin is not a superuser — it’s a member of azure_pg_admin. azuresu is Azure-managed. |
Next: For row-level data filtering (restricting which rows a role can see, not just which tables), continue to the optional Row-Level Security section.
Row-Level Security (Optional)
This section is optional. Complete it at your own pace if time permits, or after the workshop as self-study. You can safely skip to Connection Pooling with PgBouncer.
Prerequisite: You should have completed the Roles and Permissions section. The roles (
app_team,readonly,dev_user,analyst_user,contractor_user) must still exist. If you already ran the clean-up step, re-create them before proceeding.
Row-Level Security (RLS) limits which rows a role can see — not just which tables. This is essential for multi-tenant applications, compliance requirements, and data isolation scenarios where different users should see different subsets of the same table.
Why Not Use Views?
A common first instinct is to create a filtered view and grant access to the view instead of the base table:
-- The "view approach" — looks reasonable but has problems
CREATE VIEW shipped_orders AS
SELECT * FROM orders WHERE status = 'shipped';
GRANT SELECT ON shipped_orders TO readonly;
REVOKE SELECT ON orders FROM readonly;
This works on the surface — analyst_user can query shipped_orders and sees only shipped rows. But it has serious weaknesses:
1. Views don’t enforce — they filter. If someone accidentally (or intentionally) re-grants SELECT ON orders to the role, the restriction evaporates. There is no enforcement at the engine level.
2. Views leak data through functions. A clever user can bypass the view by calling functions that access the underlying table:
-- If the view owner has access to the base table, the view
-- executes with the owner's privileges (SECURITY INVOKER is not the default)
-- A user with CREATE FUNCTION privilege could potentially:
CREATE FUNCTION leak() RETURNS SETOF orders AS $$
SELECT * FROM orders;
$$ LANGUAGE sql SECURITY DEFINER;
3. Views multiply maintenance. Every filtering dimension (status, date range, country) requires a new view. Adding a column to the base table means updating every view.
4. Views can’t restrict writes. A SELECT-filtered view does nothing to stop INSERT, UPDATE, or DELETE on the base table if the role has those grants through another path.
Row-Level Security solves all of these — it adds an invisible, engine-enforced WHERE clause to every query, regardless of how the table is accessed.
Step 1 — Enable RLS on the Orders Table
Connect as your admin user:
psql -h <postgresql-fqdn> -U <pgadmin> -d orders_demo
-- Enable Row-Level Security on the orders table
ALTER TABLE orders ENABLE ROW LEVEL SECURITY;
Important: Table owners and members of
azure_pg_adminbypass RLS by default. This is by design — the admin needs unrestricted access. To test RLS, you must switch to a non-owner role.
Step 2 — Create Policies
Policies define which rows each role can see. Multiple policies on the same table are additive (OR logic) — a row is visible if any matching policy allows it.
-- Policy 1: analyst_user can only see shipped orders
CREATE POLICY analyst_shipped_only ON orders
FOR SELECT
TO readonly
USING (status = 'shipped');
-- Policy 2: app_team can see all orders (unrestricted)
CREATE POLICY app_team_full_access ON orders
FOR ALL
TO app_team
USING (true)
WITH CHECK (true);
Policy breakdown:
| Clause | Meaning |
|---|---|
FOR SELECT |
Policy applies to SELECT queries only |
FOR ALL |
Policy applies to SELECT, INSERT, UPDATE, DELETE |
TO readonly |
Policy applies to this role (and its members) |
USING (status = 'shipped') |
Row is visible only if this expression is true |
WITH CHECK (true) |
Row can be written only if this expression is true (for INSERT/UPDATE) |
Step 3 — Test RLS
-- Test as analyst_user (member of readonly)
SET ROLE analyst_user;
-- Only shipped orders are visible
SELECT status, COUNT(*) FROM orders GROUP BY status;
Expected output — only one row:
status | count
---------+-------
shipped | XXXXX
(1 row)
-- Test as dev_user (member of app_team) — sees everything
SET ROLE dev_user;
SELECT status, COUNT(*) FROM orders GROUP BY status;
Expected output — all statuses:
status | count
-----------+-------
shipped | XXXXX
pending | XXXXX
delivered | XXXXX
cancelled | XXXXX
(4 rows)
RESET ROLE;
Step 4 — More Policy Examples
Date-based policy
Analyst can only see orders from the last 90 days:
-- Drop the previous analyst policy first
DROP POLICY analyst_shipped_only ON orders;
-- Replace with a date-based policy
CREATE POLICY analyst_recent_only ON orders
FOR SELECT
TO readonly
USING (order_date >= CURRENT_DATE - INTERVAL '90 days');
Country-based policy
A regional role sees only customers in their region:
-- Enable RLS on customers
ALTER TABLE customers ENABLE ROW LEVEL SECURITY;
-- Only UK customers visible to readonly
CREATE POLICY uk_customers_only ON customers
FOR SELECT
TO readonly
USING (country = 'United Kingdom');
Session variable policy (most flexible)
The application sets a variable per session, and the policy reads it dynamically:
-- Drop the static policy
DROP POLICY IF EXISTS uk_customers_only ON customers;
-- Create a dynamic policy that reads a session variable
CREATE POLICY region_filter ON customers
FOR SELECT
TO readonly
USING (country = current_setting('app.current_region', true));
How this works in practice: The application sets
app.current_regionafter connecting (viaSETor a connection init script), and the policy automatically filters rows to that region. No view maintenance needed.
Test it:
SET ROLE analyst_user;
-- Without the variable set, current_setting returns NULL → no rows match
SELECT COUNT(*) FROM customers;
-- Returns 0
-- Application sets the region
SET app.current_region = 'United Kingdom';
SELECT COUNT(*) FROM customers;
-- Returns only UK customers
-- Change region
SET app.current_region = 'Germany';
SELECT COUNT(*) FROM customers;
-- Returns only German customers
RESET ROLE;
Step 5 — What Happens With No Matching Policy?
If RLS is enabled and a role has no policy that matches, it sees zero rows — deny-by-default:
-- contractor_user has no policy on orders
SET ROLE contractor_user;
SET ROLE app_team; -- elevate (NOINHERIT)
SELECT COUNT(*) FROM orders;
-- Returns the full count because app_team has a permissive policy
RESET ROLE;
RLS vs Views — When to Use Each
| Row-Level Security | Views | |
|---|---|---|
| Enforcement | Engine-level — cannot be bypassed regardless of access path | Application-level — bypassed if base table access is granted |
| Write control | WITH CHECK controls INSERT/UPDATE per row |
No write filtering |
| Maintenance | One policy per rule, no extra objects | One view per filter combination |
| Performance | Policy predicate is pushed into query plan | View is expanded inline (similar performance) |
| Complexity | Requires understanding of policy evaluation | Simpler conceptually |
| Best for | Multi-tenant apps, compliance, data isolation | Quick convenience filters where security is handled elsewhere |
Recommendation: Use RLS when you need enforced data isolation. Use views for convenience when the role has no direct table access anyway.
Step 6 — Clean Up
RESET ROLE;
-- Drop policies
DROP POLICY IF EXISTS app_team_full_access ON orders;
DROP POLICY IF EXISTS analyst_recent_only ON orders;
DROP POLICY IF EXISTS analyst_shipped_only ON orders;
DROP POLICY IF EXISTS region_filter ON customers;
DROP POLICY IF EXISTS uk_customers_only ON customers;
-- Disable RLS
ALTER TABLE orders DISABLE ROW LEVEL SECURITY;
ALTER TABLE customers DISABLE ROW LEVEL SECURITY;
Note: If you are done with both this section and the Roles and Permissions section, return to Step 9 in the previous section to clean up all the roles.
Summary
| Concept | What you learned |
|---|---|
| Row-Level Security | Engine-enforced row filtering per role — adds an invisible WHERE clause to every query |
| Views are not secure | Views filter but don’t enforce — re-granting base table access bypasses them entirely |
| USING clause | Controls which rows are visible (SELECT, UPDATE, DELETE) |
| WITH CHECK clause | Controls which rows can be written (INSERT, UPDATE) |
| Additive policies | Multiple policies on the same table are OR’d — a row is visible if any policy allows it |
| Deny-by-default | With RLS enabled and no matching policy, a role sees zero rows |
| Session variables | The most flexible pattern — current_setting() lets policies read per-session context |
Connection Pooling with PgBouncer (Optional)
This section is optional. Complete it at your own pace if time permits, or after the workshop as self-study.
PostgreSQL creates a new process for every client connection. Each process consumes 5–10 MB of memory and a slot in the connection table. With hundreds of application instances opening connections, this becomes a bottleneck — even if most connections are idle.
Azure Database for PostgreSQL Flexible Server includes a built-in PgBouncer connection pooler. This section shows you how to enable it and measure the difference.
Why Connection Pooling Matters
| Without pooling | With pooling |
|---|---|
| 100 app instances = 100 PostgreSQL processes | 100 app instances → PgBouncer → 20 PostgreSQL processes |
| Each process: ~5–10 MB RAM | Shared pool: much less total RAM |
| Connection setup: ~5–50 ms per connection (TCP + TLS + auth) | Connection reuse: < 1 ms |
| Max connections limit hit easily | App can open many connections safely |
How it differs from Oracle and SQL Server:
- Oracle: Uses a thread-based model with shared server processes. Connection pooling is at the app level (e.g., Oracle Connection Pool in JDBC).
- SQL Server: Uses thread-per-request with lightweight worker threads (~512 KB each). Built-in connection pooling in ADO.NET.
- PostgreSQL: Process-per-connection (~5–10 MB each). Connection pooling is external — PgBouncer, PgPool-II, or the built-in PgBouncer in Azure.
Step 1 — Check Current Connection Usage
Connect to orders_demo:
psql -h <postgresql-fqdn> -U <pgadmin> -d orders_demo
Once connected, check the current connections:
-- Current connections
SELECT count(*) AS total_connections FROM pg_stat_activity;
-- Breakdown by state
SELECT state, count(*)
FROM pg_stat_activity
GROUP BY state
ORDER BY count DESC;
-- Max allowed
SHOW max_connections;
Step 2 — Enable Built-in PgBouncer
- Go to Azure Portal → your PostgreSQL server → Server parameters
- Search for
pgbouncer.enabled - Set to true
- Configure these parameters:
| Parameter | Recommended Value | Meaning |
|---|---|---|
pgbouncer.enabled |
true |
Enables the built-in PgBouncer |
pgbouncer.pool_mode |
transaction |
Connections are returned to the pool after each transaction |
pgbouncer.default_pool_size |
20 |
Max server connections per user/database pair |
pgbouncer.max_client_conn |
200 |
Max client connections PgBouncer accepts |
pgbouncer.min_pool_size |
5 |
Minimum idle connections kept warm |
- Click Save
Pool modes explained:
| Mode | Connection returned when | Use case |
|---|---|---|
session |
Client disconnects | Long-lived sessions, PREPARE/LISTEN |
transaction |
Transaction ends (COMMIT/ROLLBACK) | Most web apps — recommended |
statement |
Each SQL statement completes | Multi-statement transactions break — rarely used |
Warning: In
transactionmode, session-level features likeSET,PREPARE, temporary tables, andLISTEN/NOTIFYdo not persist across transactions. If your application relies on these, usesessionmode.
Step 3 — Create a PgBouncer-Compatible Login Role (MD5)
Azure-managed PgBouncer cannot use SCRAM-SHA-256 for client authentication. The built-in pooler has no mechanism to retrieve the SCRAM verifier from the server, so connections that use SCRAM passwords will fail with an authentication error on port 6432.
This is an architectural limitation of the Azure PgBouncer integration, not a protocol limitation — SCRAM itself works fine on direct connections (port 5432).
The workaround is to create a dedicated pool login role with an MD5 password:
Connect to the server on the direct port (5432) as the admin:
psql -h <postgresql-fqdn> -U <pgadmin> -d orders_demo
First, confirm the server’s current password encryption method:
SHOW password_encryption;
Expected output:
password_encryption
---------------------
scram-sha-256
(1 row)
This confirms the server defaults to SCRAM — which is what we want for all regular roles. Now temporarily switch to MD5 for the pool role:
-- Switch this session to MD5 password hashing
SET password_encryption = 'md5';
Verify the session change took effect:
SHOW password_encryption;
password_encryption
---------------------
md5
(1 row)
Now create the role (its password will be stored as MD5):
-- Create a dedicated PgBouncer login role
CREATE ROLE app_pool LOGIN PASSWORD 'MyPoolPassword123!';
-- Grant access to the tables in orders_demo
GRANT SELECT, INSERT, UPDATE, DELETE ON ALL TABLES IN SCHEMA public TO app_pool;
Revert the session back to SCRAM and confirm:
-- Revert session back to the default
SET password_encryption = 'scram-sha-256';
SHOW password_encryption;
password_encryption
---------------------
scram-sha-256
(1 row)
You can also verify that app_pool was stored with MD5 while your admin role remains SCRAM:
SELECT rolname,
CASE WHEN rolpassword LIKE 'md5%' THEN 'md5'
WHEN rolpassword LIKE 'SCRAM%' THEN 'scram-sha-256'
ELSE 'unknown'
END AS password_type
FROM pg_authid
WHERE rolname IN ('app_pool', current_user);
Expected output:
rolname | password_type
-----------+---------------
<pgadmin> | scram-sha-256
app_pool | md5
(2 rows)
Why MD5 only for this role? The
SET password_encryptionchange is session-scoped — it only affects theCREATE ROLEstatement in the same session. Your admin account and all other roles remain SCRAM-protected. Theapp_poolrole is used exclusively for pooled connections through port 6432.
Security note: Use a strong, unique password for
app_pool. In production, store it in Azure Key Vault and rotate it regularly. Do not reuse the admin password.
Step 4 — Connect Through PgBouncer
PgBouncer listens on port 6432 (not the default 5432). Connect using the app_pool role you just created:
psql -h <postgresql-fqdn> -U app_pool -d orders_demo -p 6432
Enter the password MyPoolPassword123! when prompted.
Verify you’re going through PgBouncer:
SHOW server_version; -- works: forwarded to PostgreSQL
Run a query to confirm:
SELECT count(*) FROM orders;
Step 5 — Load Test: With and Without PgBouncer
Use pgbench from the jumpbox to simulate concurrent connections. pgbench ships in the postgresql-contrib package, which is not installed by default on Rocky Linux. Install it from the PGDG repository:
sudo dnf -y module disable postgresql # prevent AppStream from pulling PG13
sudo dnf install -y postgresql18-contrib # includes pgbench, pg_stat_statements, etc.
pgbench --version # should show: pgbench (PostgreSQL) 18.x
Why
module disable? Rocky Linux ships apostgresqlAppStream module (usually PG13). Without disabling it,dnfmay resolve to the older version and overwrite your PGDGpsqlbinary.
Without PgBouncer (port 5432 — direct, SCRAM auth):
pgbench -h <postgresql-fqdn> -U <pgadmin> -d orders_demo -p 5432 \
-c 50 -j 4 -T 30 -S
Flags:
-c 50— 50 concurrent client connections-j 4— 4 worker threads-T 30— run for 30 seconds-S— SELECT-only workload (read-only)
Note the TPS (transactions per second) and latency average.
With PgBouncer (port 6432 — pooled, MD5 app_pool role):
pgbench -h <postgresql-fqdn> -U app_pool -d orders_demo -p 6432 \
-c 50 -j 4 -T 30 -S
Enter the app_pool password when prompted.
Compare:
| Metric | Port 5432 (direct) | Port 6432 (PgBouncer) |
|---|---|---|
| TPS | _____ | _____ |
| Avg latency (ms) | _____ | _____ |
| Connection errors | _____ | _____ |
Typical results:
- PgBouncer shows higher TPS and lower latency because connection setup is eliminated
- At higher concurrency (200+ clients), direct connections may hit
max_connectionsand fail; PgBouncer queues them
Step 6 — Monitor PgBouncer via Server Parameters
PgBouncer statistics are available through the pgbouncer virtual database:
psql -h <postgresql-fqdn> -U app_pool -d pgbouncer -p 6432
SHOW POOLS;
SHOW STATS;
SHOW CLIENTS;
SHOW SERVERS;
| View | Shows |
|---|---|
SHOW POOLS |
Active/waiting/idle connections per pool |
SHOW STATS |
Requests, bytes in/out, query time per pool |
SHOW CLIENTS |
Every connected client and their state |
SHOW SERVERS |
Backend PostgreSQL connections being used |
Summary
| Concept | Key takeaway |
|---|---|
| Process-per-connection | PostgreSQL forks a process for each client — expensive at scale |
| PgBouncer | Multiplexes many client connections onto fewer backend connections |
| Transaction mode | Best for web apps — connections are recycled after each COMMIT |
| Port 6432 | Built-in PgBouncer listens here on Azure Flexible Server |
| pgbench | Built-in tool for load testing connection handling |
Accessibility and Business Continuity
Logical Backup and Restore
PostgreSQL ships three logical backup utilities: pg_dump (single database), pg_dumpall (entire cluster), and pg_restore (restore non-plain formats). In this section you will practice all the common dump and restore patterns using the orders_demo database.
Note: If you have already completed the Index Tuning Lab, your dump will include the indexes you added. If not, only primary-key indexes will appear — that is expected.
Reminder: If your libpq environment variables are not set, run
source ~/.pg_azureon the jumpbox first. All commands below run on the jumpbox Linux shell, not inside psql.

Step 1 — Plain-Text Dump
The simplest format. Output is a SQL script you can replay with psql.
pg_dump orders_demo > /tmp/orders_demo.plain.sql
Inspect the output:
less /tmp/orders_demo.plain.sql
You will see CREATE TABLE, COPY data blocks, and CREATE INDEX statements.
Schema only (no data):
pg_dump --schema-only orders_demo > /tmp/orders_demo_ddl.sql
less /tmp/orders_demo_ddl.sql
Data only:
pg_dump --data-only orders_demo > /tmp/orders_demo_data.sql
less /tmp/orders_demo_data.sql
INSERT statements instead of COPY:
pg_dump --data-only --inserts orders_demo > /tmp/orders_demo_inserts.sql
less /tmp/orders_demo_inserts.sql
When to use
--inserts: COPY is much faster, but INSERT-based dumps are more portable (e.g., loading into a different RDBMS). Use COPY for PostgreSQL-to-PostgreSQL restores.
Single table:
pg_dump --table=customers orders_demo > /tmp/customers.sql
less /tmp/customers.sql
Step 2 — Custom Format Dump
Custom format (-Fc) compresses the data and allows selective restore with pg_restore:
pg_dump -Fc orders_demo -f /tmp/orders_demo.custom.dump
ls -lh /tmp/orders_demo.custom.dump
Compare the file size to the plain-text dump — custom format is significantly smaller.
Step 3 — Directory Format Dump
Directory format (-Fd) is the only format that supports parallel jobs:
pg_dump -Fd -j 4 orders_demo -f /tmp/orders_demo_dir
ls -la /tmp/orders_demo_dir/
The -j 4 flag uses 4 parallel workers. You will see one compressed file per table plus a toc.dat table of contents.
Step 4 — Restore to a Separate Test Database
Instead of dropping orders_demo, create a new database to practice the restore:
psql -d postgres -c "CREATE DATABASE orders_demo_restored;"
Restore from custom format:
pg_restore -d orders_demo_restored --no-owner --verbose /tmp/orders_demo.custom.dump
Verify:
psql -d orders_demo_restored -c "
SELECT 'customers' AS tbl, COUNT(*) FROM customers
UNION ALL SELECT 'products', COUNT(*) FROM products
UNION ALL SELECT 'orders', COUNT(*) FROM orders
UNION ALL SELECT 'order_items', COUNT(*) FROM order_items;"
Check the indexes that are present:
psql -d orders_demo_restored -c "\di"
Restore from directory format (parallel):
psql -d postgres -c "DROP DATABASE IF EXISTS orders_demo_restored;"
psql -d postgres -c "CREATE DATABASE orders_demo_restored;"
pg_restore -d orders_demo_restored -j 4 --no-owner --verbose /tmp/orders_demo_dir
Step 5 — Global Objects Dump
pg_dumpall is the only tool that can dump roles, tablespaces, and other cluster-wide objects that pg_dump cannot:
pg_dumpall > /tmp/whole_cluster.sql
less /tmp/whole_cluster.sql
For just the global objects (roles + tablespaces):
pg_dumpall -g --no-role-passwords > /tmp/globals.sql
less /tmp/globals.sql
The
--no-role-passwordsflag avoids errors on Azure Flexible Server where you cannot export passwords from managed roles.
Step 6 — Clean Up
Drop the test database:
psql -d postgres -c "DROP DATABASE IF EXISTS orders_demo_restored;"
The original orders_demo database is untouched and ready for subsequent sections.
Summary
| Tool | Output format | Parallel | Selective restore | Use case |
|---|---|---|---|---|
pg_dump (plain) |
SQL text | No | No (full replay) | Simple, human-readable, cross-database |
pg_dump -Fc |
Custom binary | No | Yes (pg_restore -t) |
Standard single-DB backup |
pg_dump -Fd |
Directory | Yes (-j N) |
Yes | Large databases, fastest backup |
pg_dumpall |
SQL text | No | No | Global objects + all databases |
pg_restore |
(reads Fc/Fd) | Yes (-j N) |
Yes | Restore from custom/directory format |
Tip: For optimizing large migrations using dump and restore, see the Azure migration optimization guide.
Physical Backup and Point in Time Restore
Backup
When creating a server through the Azure portal, use the Compute tier tab to select either Burstable, General Purpose, or Memory Optimized for your server. This window is also where you set the Backup Retention Period—the number of days backups are stored.
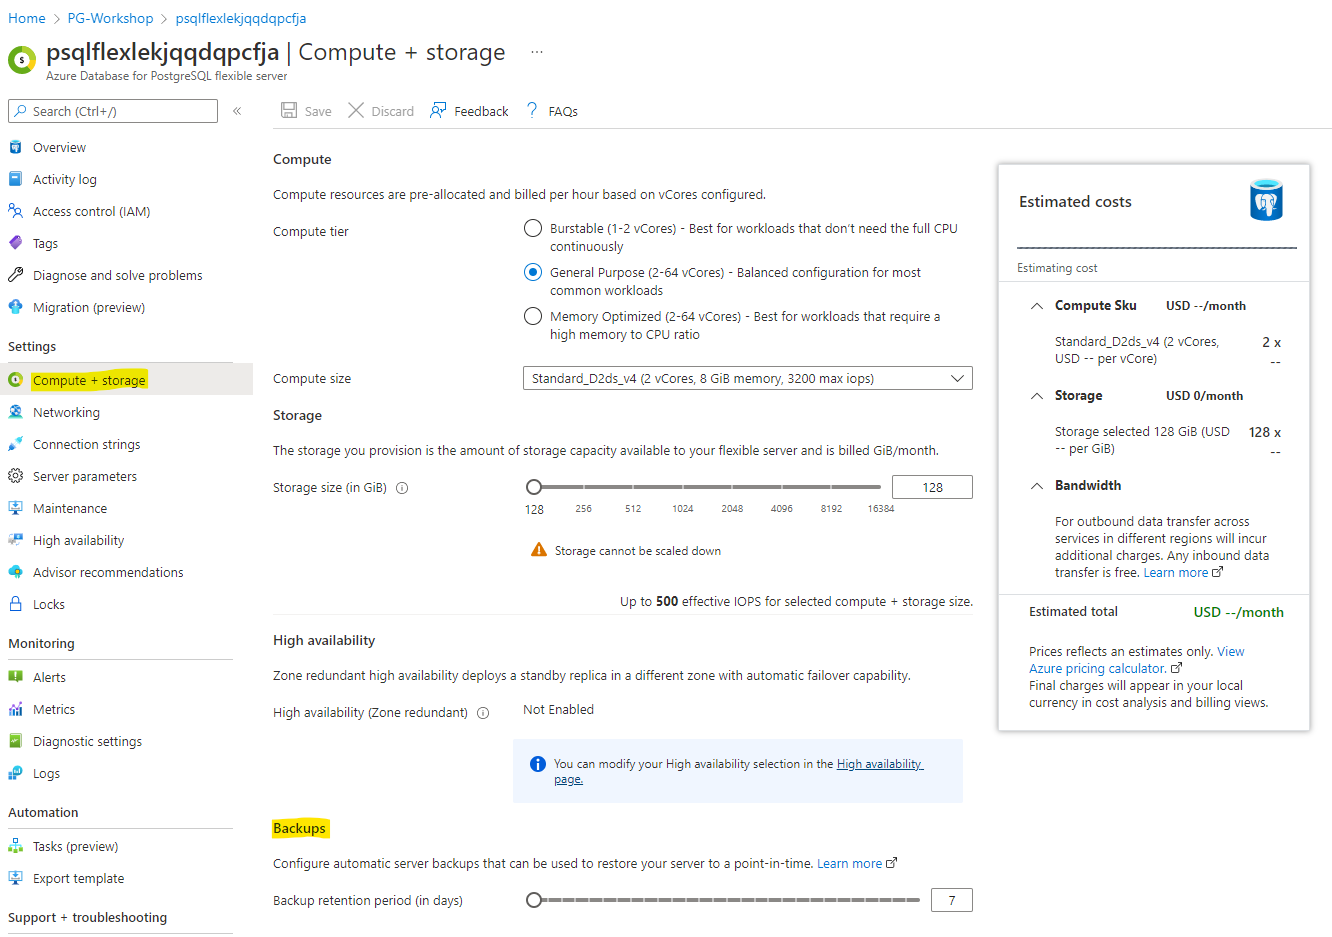
The backup retention period determines how far back in time you can restore using point-in-time restore, as it depends on the available backups.
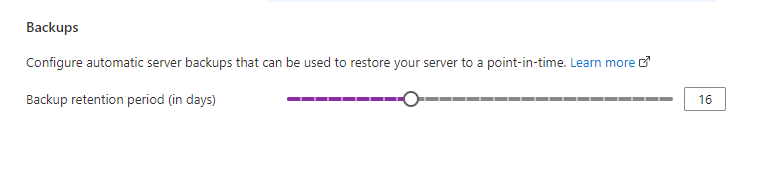
After changing the retention period, make sure to click Save.
When the deployment is finished, the retention period has been updated.
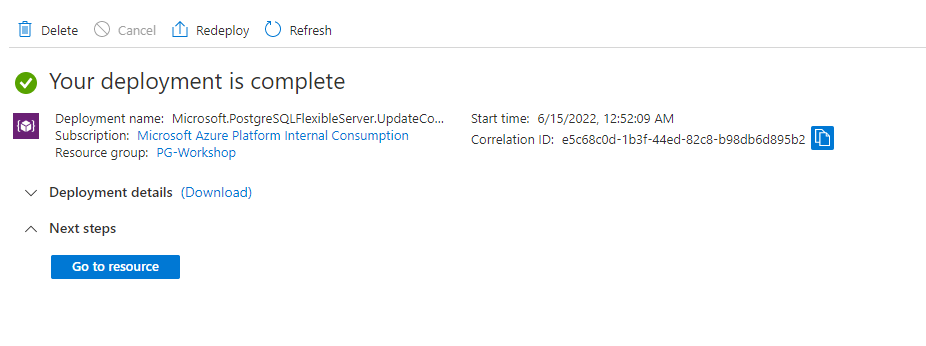
Point-in-Time Restore
Azure Database for PostgreSQL Flexible Server allows you to restore your server to a specific point in time, creating a new copy of the server. You can use this new server to recover data or redirect your client applications.
For example, if a table was accidentally dropped at noon, you can restore to just before noon and retrieve the missing table and data from the new server copy. Note: Point-in-time restore operates at the server level, not the database level.
To restore to a point in time:
- In the Azure portal, select your Azure Database for PostgreSQL Flexible Server.
- On the server’s Overview page, click Restore in the toolbar.
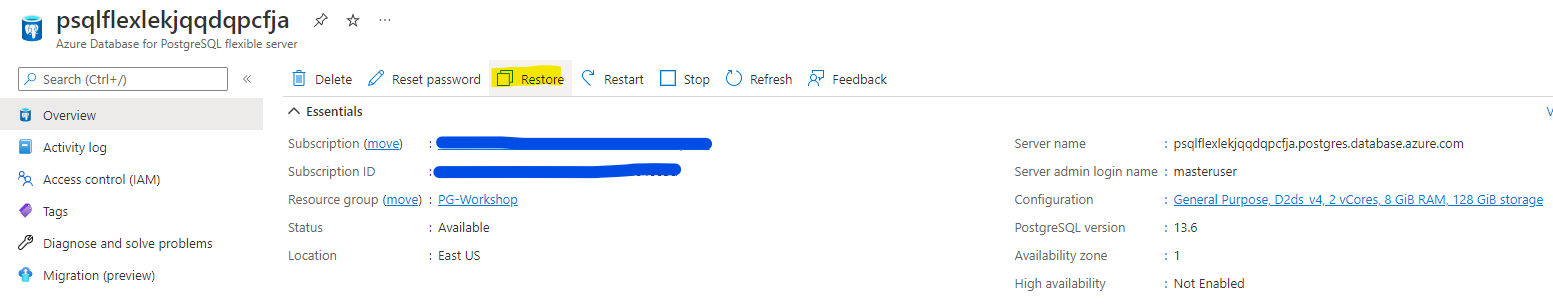
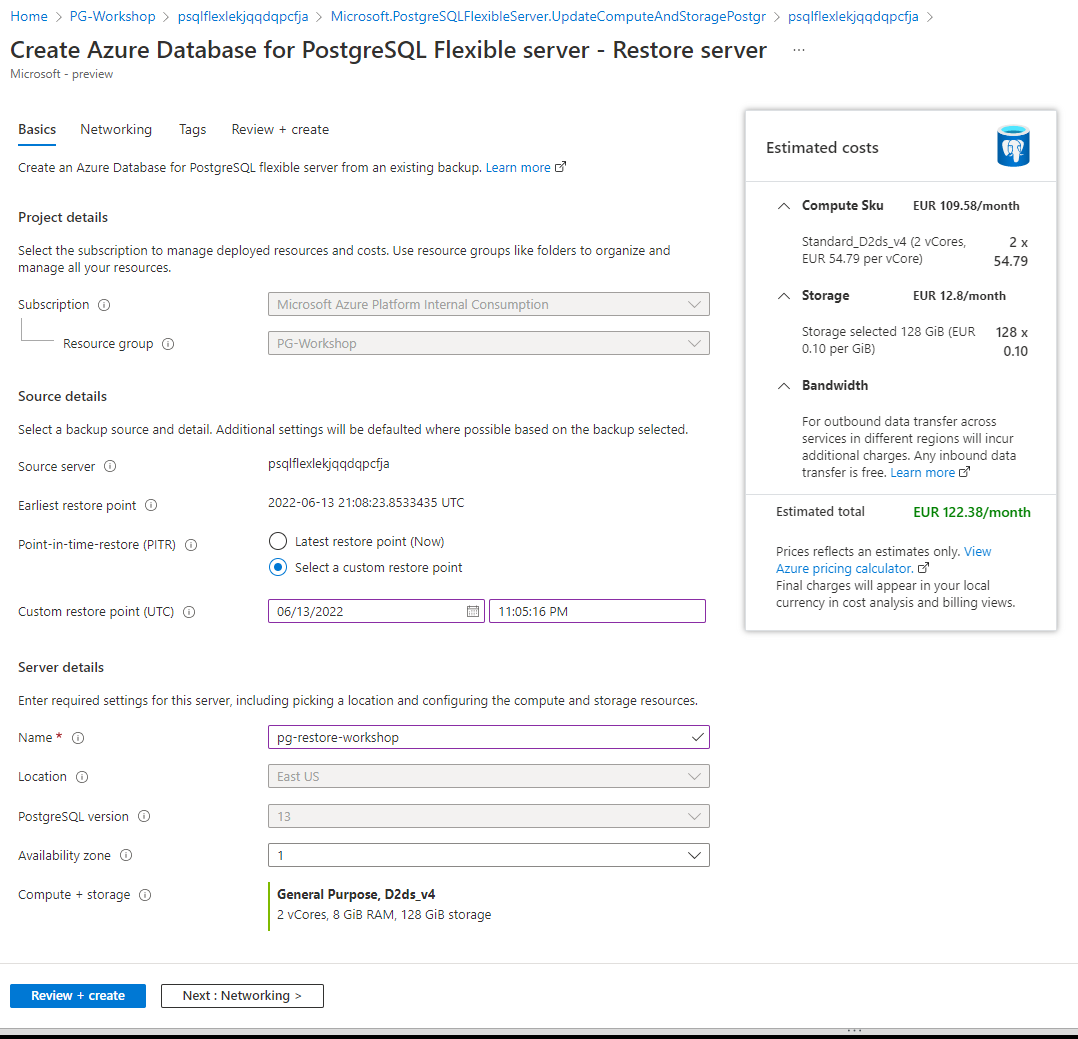
The new server created by point-in-time restore will have the same server admin login name and password as the original server at the selected restore time. You can change the password from the new server’s Overview page.
Important:
The new server created during a restore does not have the firewall rules or VNet service endpoints from the original server. You must set up these rules separately for the new server.
Logical Replication (Optional)
This section is optional. It requires deploying a second PostgreSQL Flexible Server. Complete it if time permits, or after the workshop as self-study.
Native Logical Replication
Logical replication uses the terms publisher and subscriber:
- The publisher is the PostgreSQL database you are sending data from.
- The subscriber is the PostgreSQL database you are sending data to.

Step 1 — Deploy a Second Flexible Server
The command below creates a Burstable-tier server in the same VNet. Review and adjust the parameters to match your environment before running:
--resource-group— must match your workshop resource group--vnet/--subnet— must match your spoke VNet and a subnet delegated to PostgreSQL--admin-user/--admin-password— choose your own credentials--name— must be globally unique
# Review and adjust the values below before running
az postgres flexible-server create \
--resource-group PG-Workshop \
--vnet spoke-vnet \
--subnet subnet-02 \
--name replication-flex-<unique-suffix> \
--admin-user replica \
--admin-password '<strong-password>' \
--sku-name Standard_B1ms \
--tier Burstable \
--storage-size 128 \
--version 18 \
--high-availability Disabled
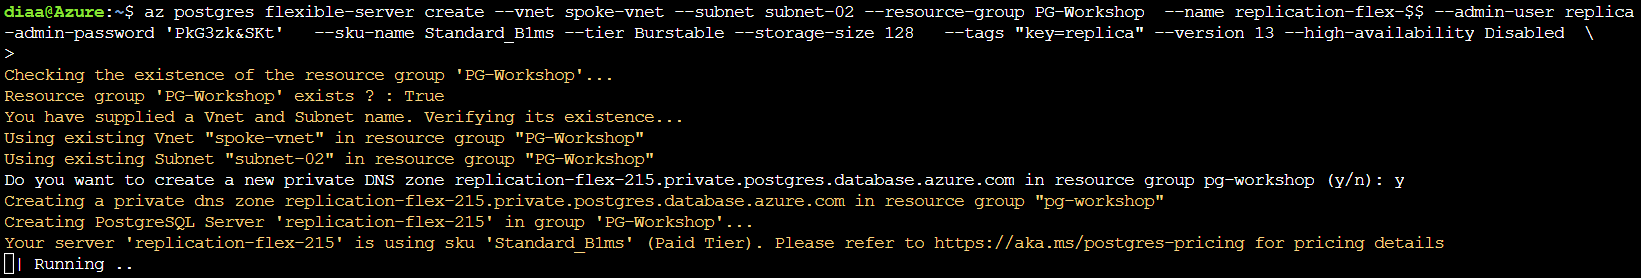
While the replication server is being deployed, you can update the primary database parameters:
- Go to the server parameters page in the Azure portal.
- Set the server parameter wal_level to
logical. - Update max_worker_processes to at least
16. Otherwise, you may encounter issues such as:
WARNING: out of background worker slots. - Save the changes and restart the server to apply the wal_level change.
- Confirm that your PostgreSQL instance allows network traffic from your connecting resource.
- Grant the admin user replication permissions:
ALTER ROLE <adminname> WITH REPLICATION;
Replace <adminname> with the PostgreSQL user you created in the first section.
On the primary database, create the publication:
\c orders_demo
CREATE PUBLICATION customers_pub FOR TABLE customers;
Check if the database replica has finished deploying. The output should look like the following image:
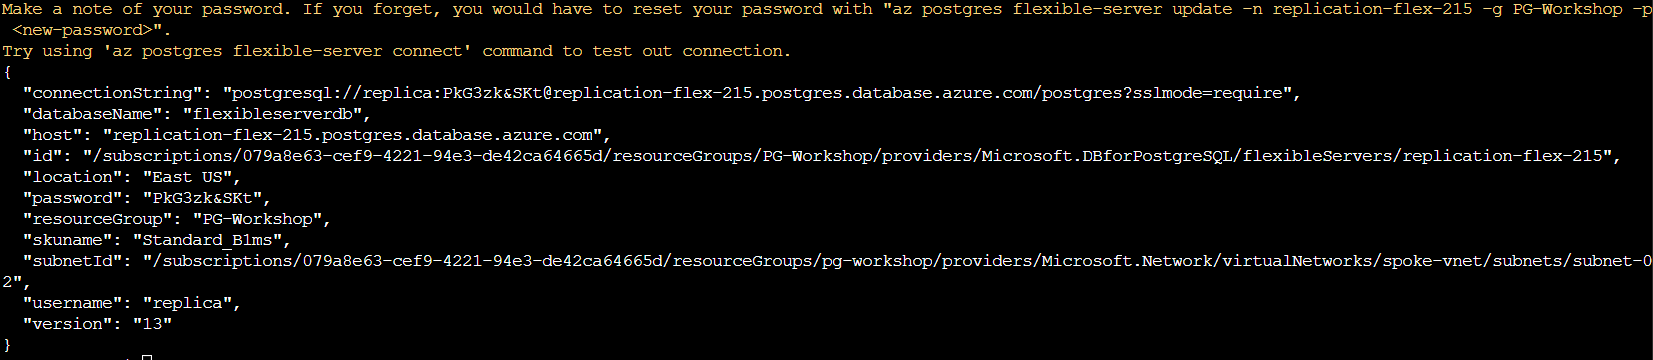
Once the replica server is deployed, update the Private DNS to private.postgresql.database.azure.com:
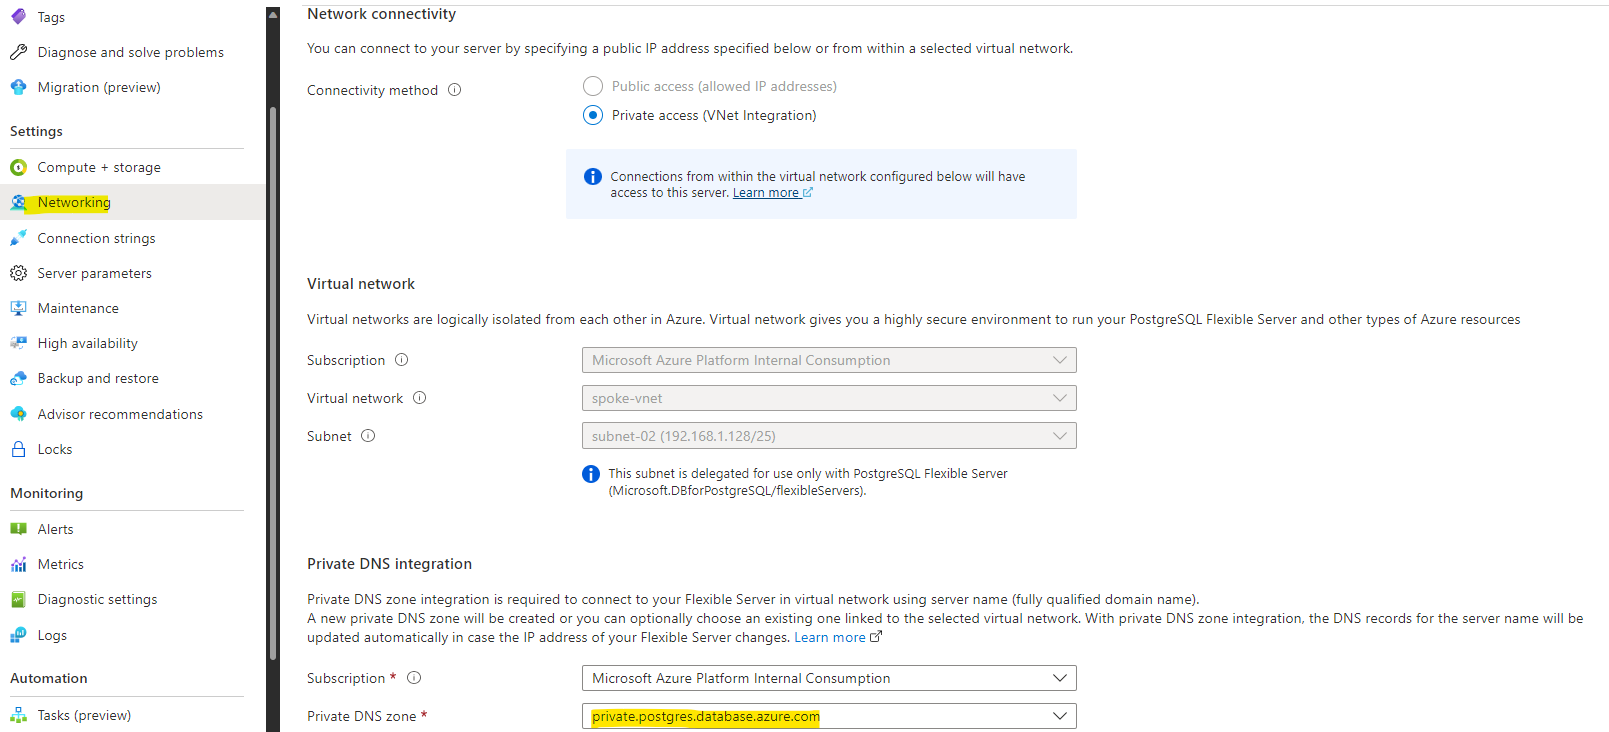
Note the name of the PostgreSQL server: replication-flex-<Random Number>.postgres.database.azure.com.
Log in to the jumpbox and access the newly created database (replace <123> with your actual number):
psql -d postgres -U replica -h replication-flex-<123>.postgres.database.azure.com
When prompted, enter the password you chose during replica server creation.
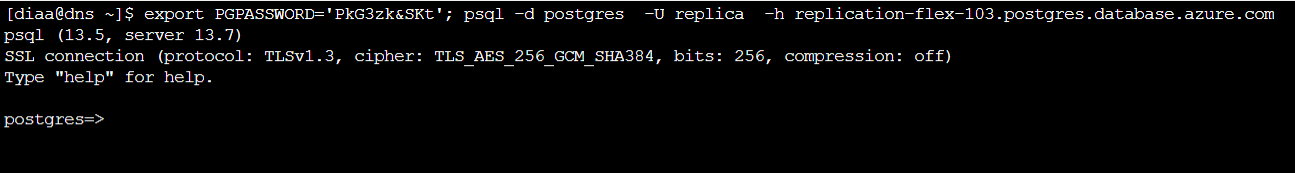
Once connected, create the database and table. The table structure must match the published table on the primary:
CREATE DATABASE orders_demo;
\connect orders_demo
CREATE TABLE public.customers (
customer_id serial PRIMARY KEY,
first_name text NOT NULL,
last_name text NOT NULL,
email text NOT NULL,
city text,
country text,
loyalty_points integer DEFAULT 0,
created_at timestamp DEFAULT now()
);
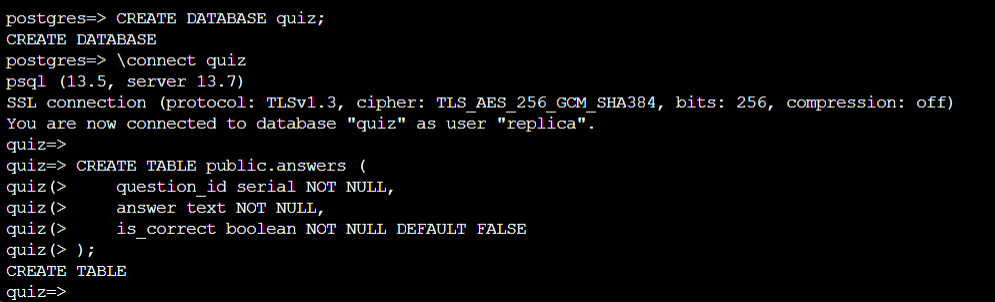
Now, create the subscription. Make sure to change the connection parameters to match your environment:
CREATE SUBSCRIPTION customers_sub
CONNECTION 'host=<primary-private-ip> user=<pgadmin> dbname=orders_demo password=<your-password>'
PUBLICATION customers_pub;
Replace
<primary-private-ip>,<pgadmin>, and<your-password>with the values for your primary server.
Check the customers table. It should not be empty — the initial data sync copies all existing rows:
SELECT COUNT(*) FROM customers;
SELECT * FROM customers LIMIT 10;
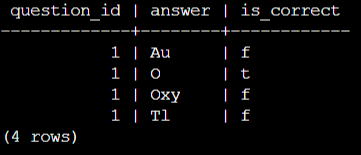
HA/DR
High Availability
Azure Database for PostgreSQL Flexible Server offers high availability with automatic failover using zone-redundant server deployment. When deployed in a zone-redundant configuration, Flexible Server automatically provisions and manages a standby replica in a different availability zone. Using PostgreSQL streaming replication, data is replicated to the standby replica server in synchronous mode.
Key Concepts
| Concept | Details |
|---|---|
| Standby mode | Zone-redundant — primary and standby in different availability zones within the same region |
| Replication | Synchronous streaming replication — every committed transaction is written to the standby before the client receives acknowledgement |
| Failover — Forced | Simulates an unplanned outage. The standby is promoted to primary. Expect 60–120 seconds of downtime. DNS is updated automatically — no connection string change needed. |
| Failover — Planned | Graceful switch with near-zero data loss. The primary finishes in-flight transactions, then the standby takes over. Expect 30–60 seconds of downtime. |
| RPO (Recovery Point Objective) | Zero for zone-redundant HA — synchronous replication means no committed data is lost |
| RTO (Recovery Time Objective) | Typically 60–120 seconds including DNS propagation |
| Application impact | Applications using the FQDN reconnect automatically after DNS updates. Connection retry logic is essential — brief connection failures are expected during any failover. |
Important: HA protects against infrastructure failures (VM crash, availability zone outage). It does not protect against data corruption or accidental
DROP TABLE— for that, use Point-in-Time Restore (see previous section).
Tasks
Configure High Availability
- Click the High Availability tab to configure high availability.
-
Check the box to enable high availability and save your changes. This will trigger a high availability deployment.
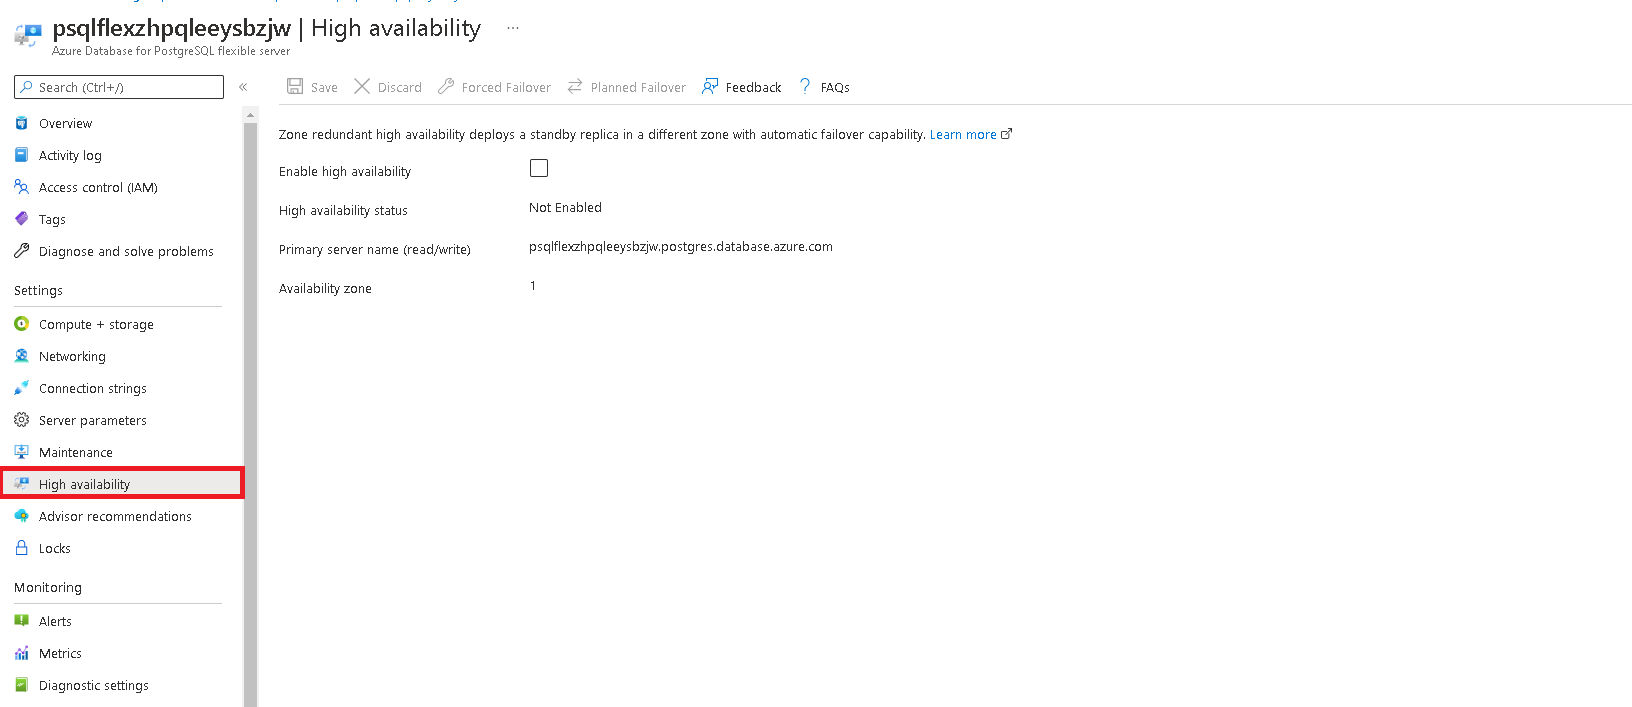
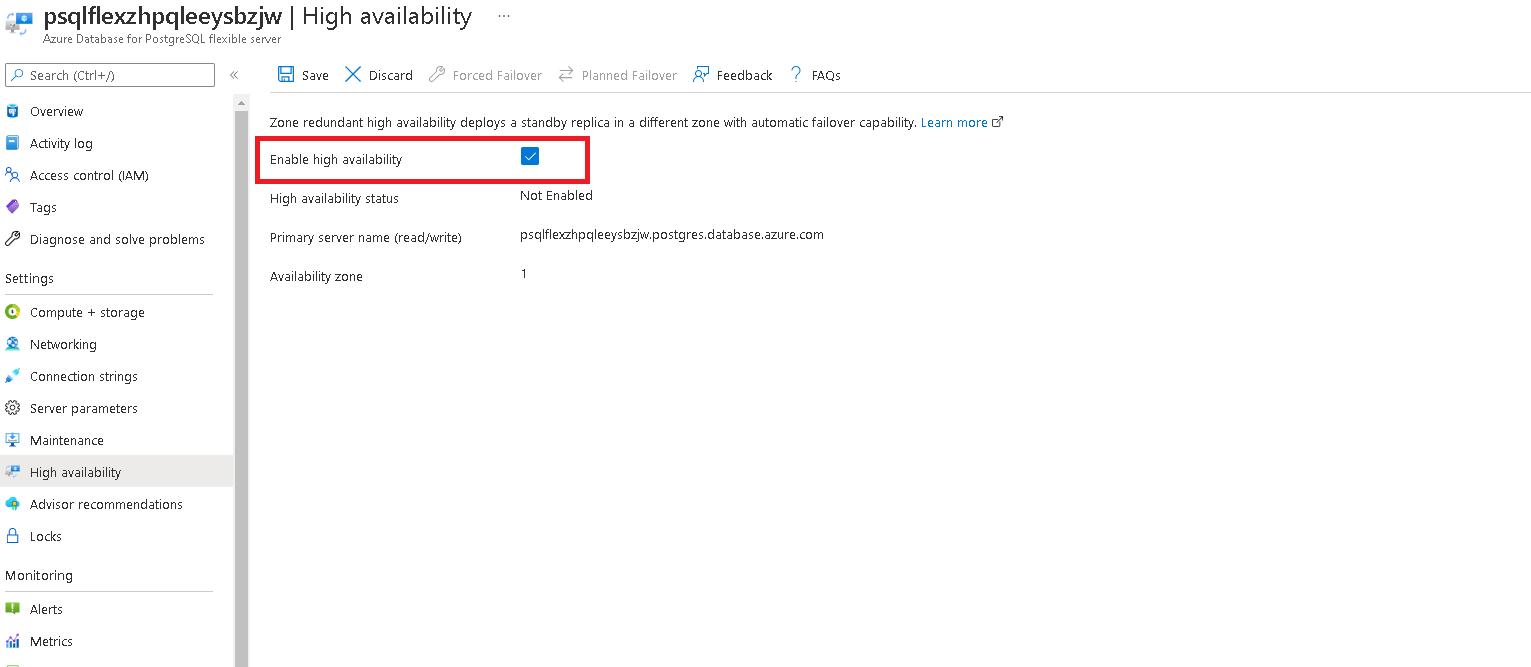
-
When prompted, confirm your selection.
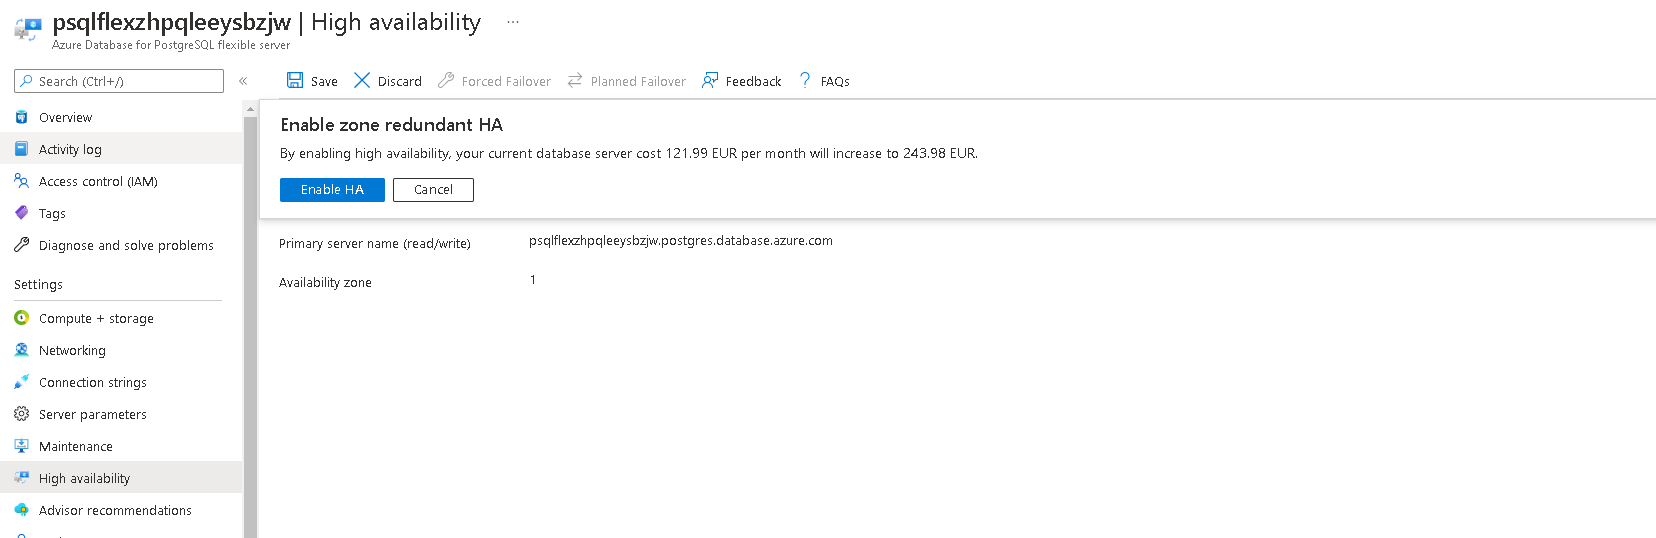
-
After deployment is complete, you will receive a confirmation message.
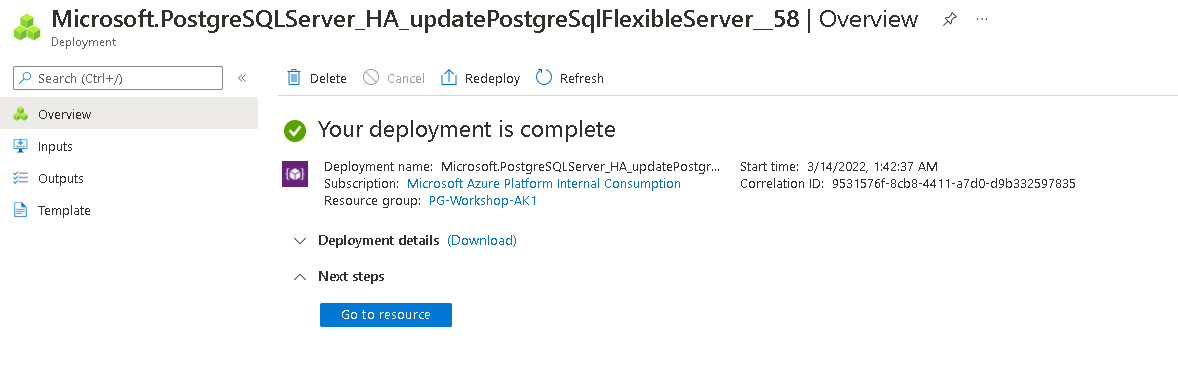
Execute a Forced Failover
A forced failover simulates an unplanned outage — the standby is promoted without waiting for the primary to shut down cleanly. Use this to test your application’s reconnect behaviour.
-
In the Azure portal, click the Forced Failover button to initiate a failover to the secondary server.
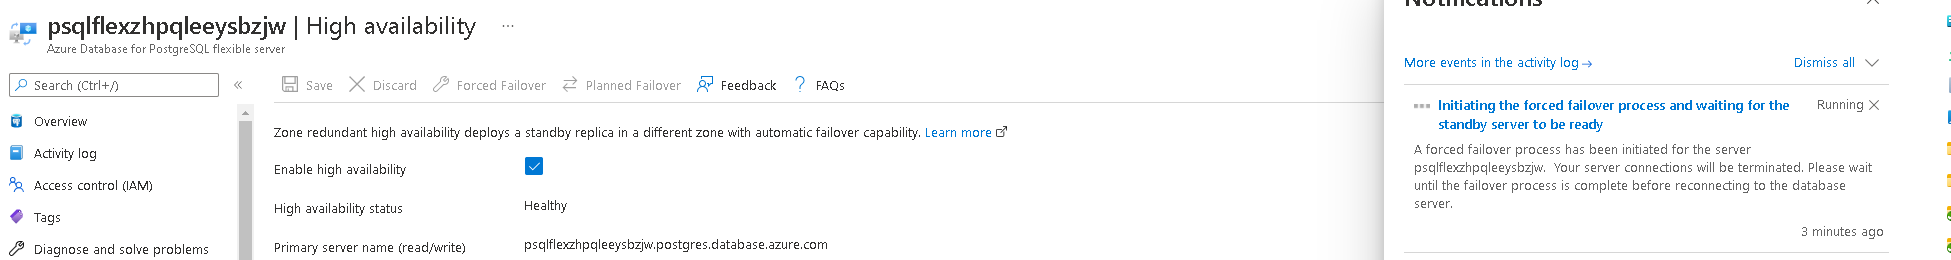
-
You will see a message once failover is complete (typically 60–120 seconds).
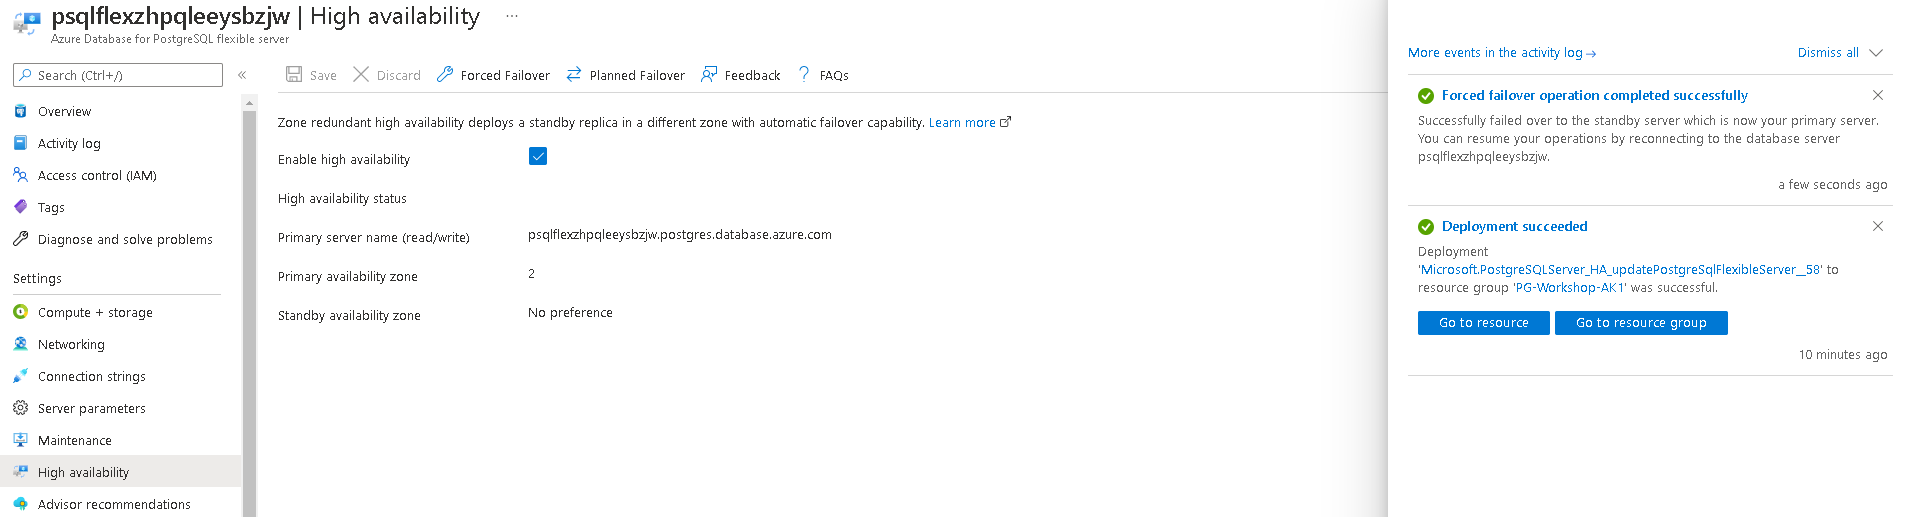
-
Verify that the primary and secondary zones have interchanged.
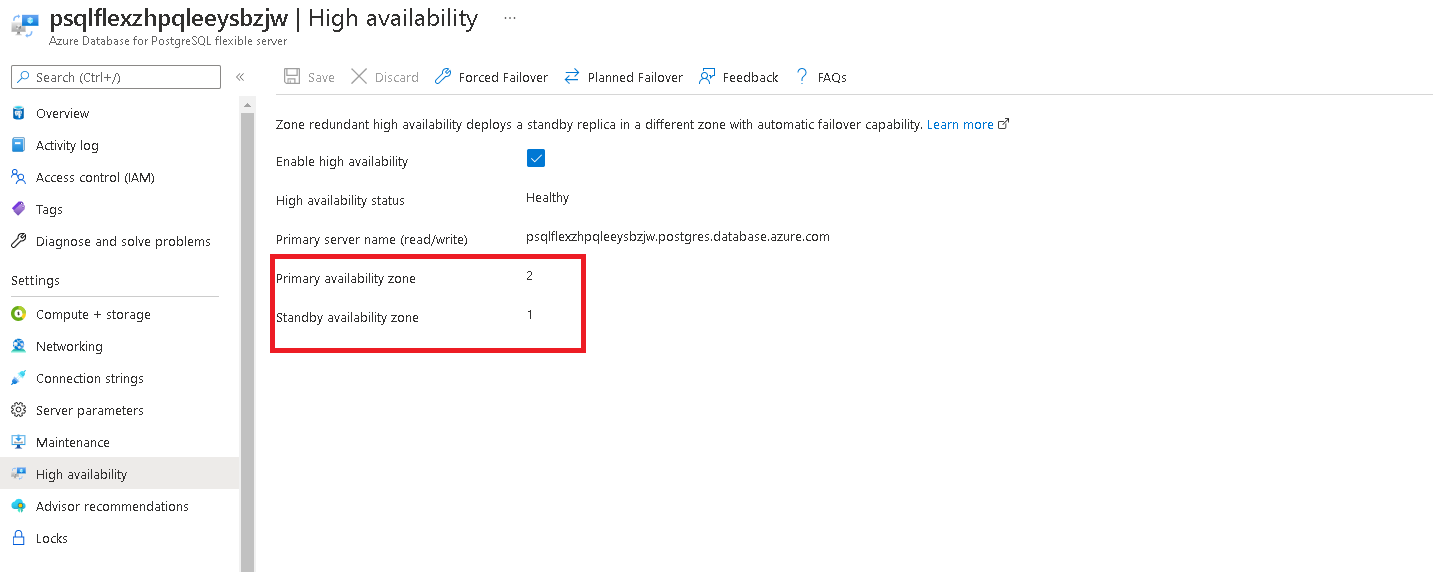
What to watch for: During failover, existing connections will drop. Applications should implement connection retry logic — most PostgreSQL drivers support this natively. The FQDN stays the same; DNS updates propagate within seconds.
Execute a Planned Failover
A planned failover is graceful — the primary finishes in-flight transactions, then hands over to the standby. Downtime is typically 30–60 seconds.
-
In the Azure portal, click the Planned Failover button to initiate a planned failover to the secondary server.
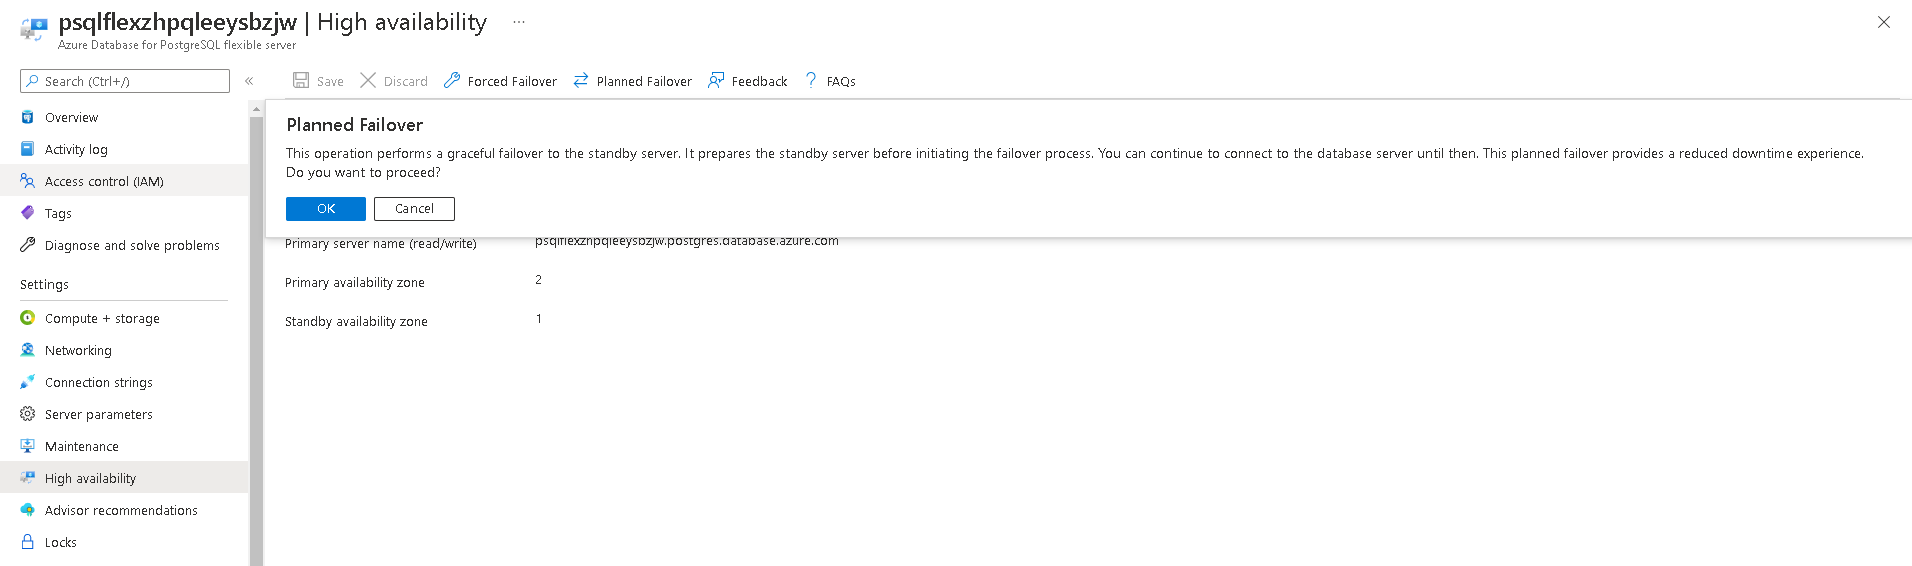
-
You will see a message once failover is complete.
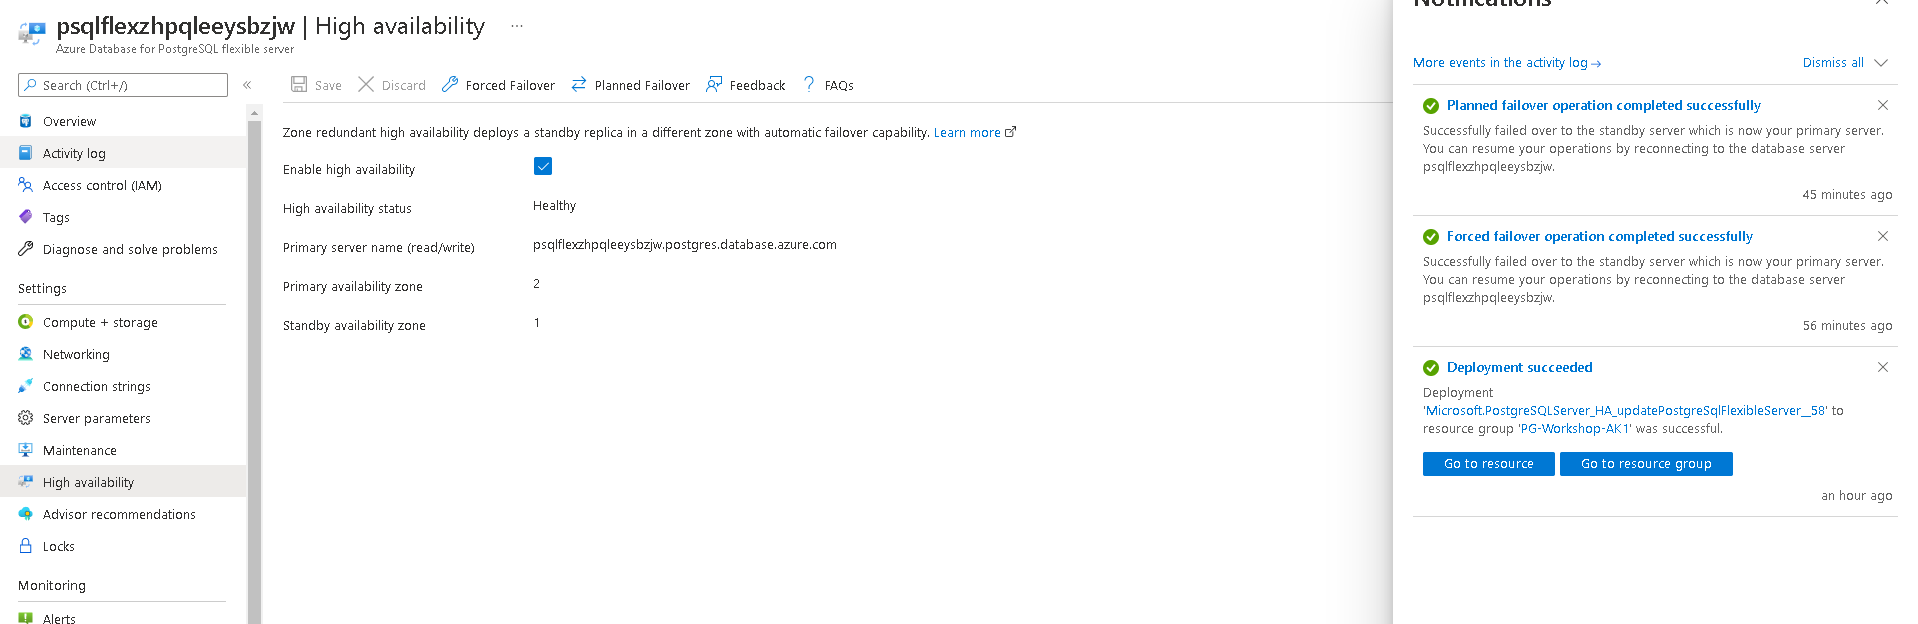
Disable High Availability
-
Navigate to the High Availability tab.
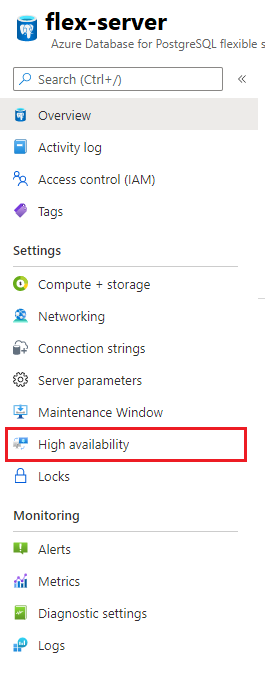
-
Uncheck the availability option and click Save.
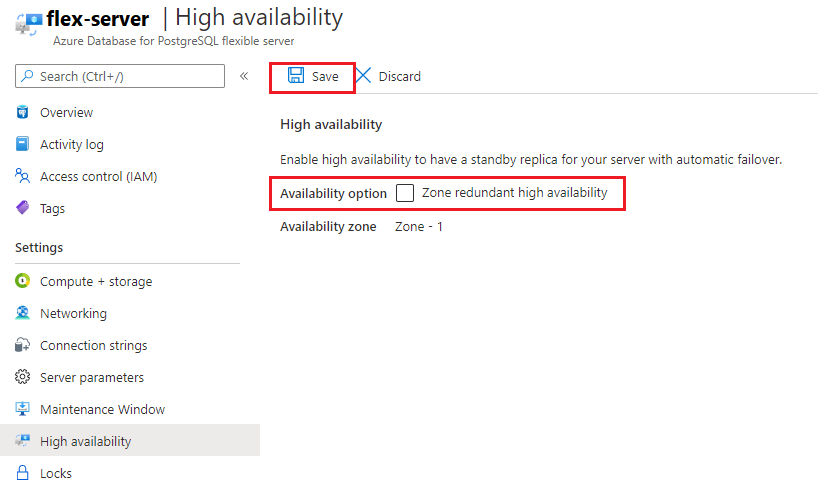
Patching and maintenance windows
Scheduled maintenance in Azure Database for PostgreSQL – Flexible server
Azure Database for PostgreSQL - Flexible server performs periodic maintenance to keep your managed database secure, stable, and up-to-date. During maintenance, the server gets new features, updates, and patches.
What happens during maintenance?
| Aspect | Details |
|---|---|
| What’s patched | OS-level security patches, PostgreSQL minor version upgrades, Azure platform updates |
| Frequency | Approximately once per month, though critical security patches may arrive sooner |
| Downtime | Typically a few seconds to a couple of minutes — the server restarts after patching. If HA is enabled, failover minimises the window further. |
| Notification | Azure sends a 5-day advance notification to subscription admins before scheduled maintenance |
| Custom schedule | You can choose your preferred day of the week and start hour (30-minute window), or let Azure decide (system-managed) |
Best practice: Set the custom maintenance window to a low-traffic period (e.g., Saturday 02:00 UTC) so restarts have minimal impact.
Configuring a custom maintenance window
Configuring a custom maintenance window
Navigate to the maintenance tab in Azure portal for your flexible server.
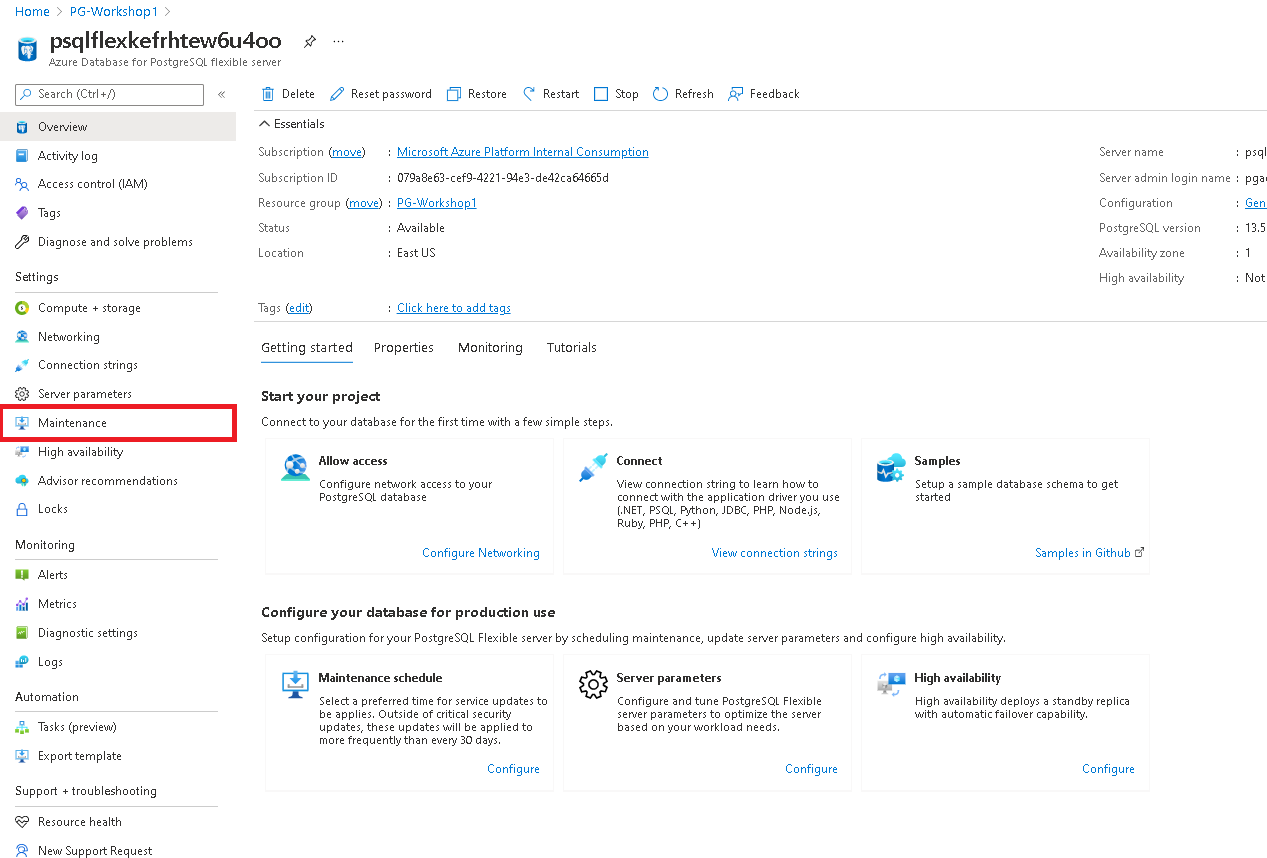
Select a custom schedule from the options available in the drop down.
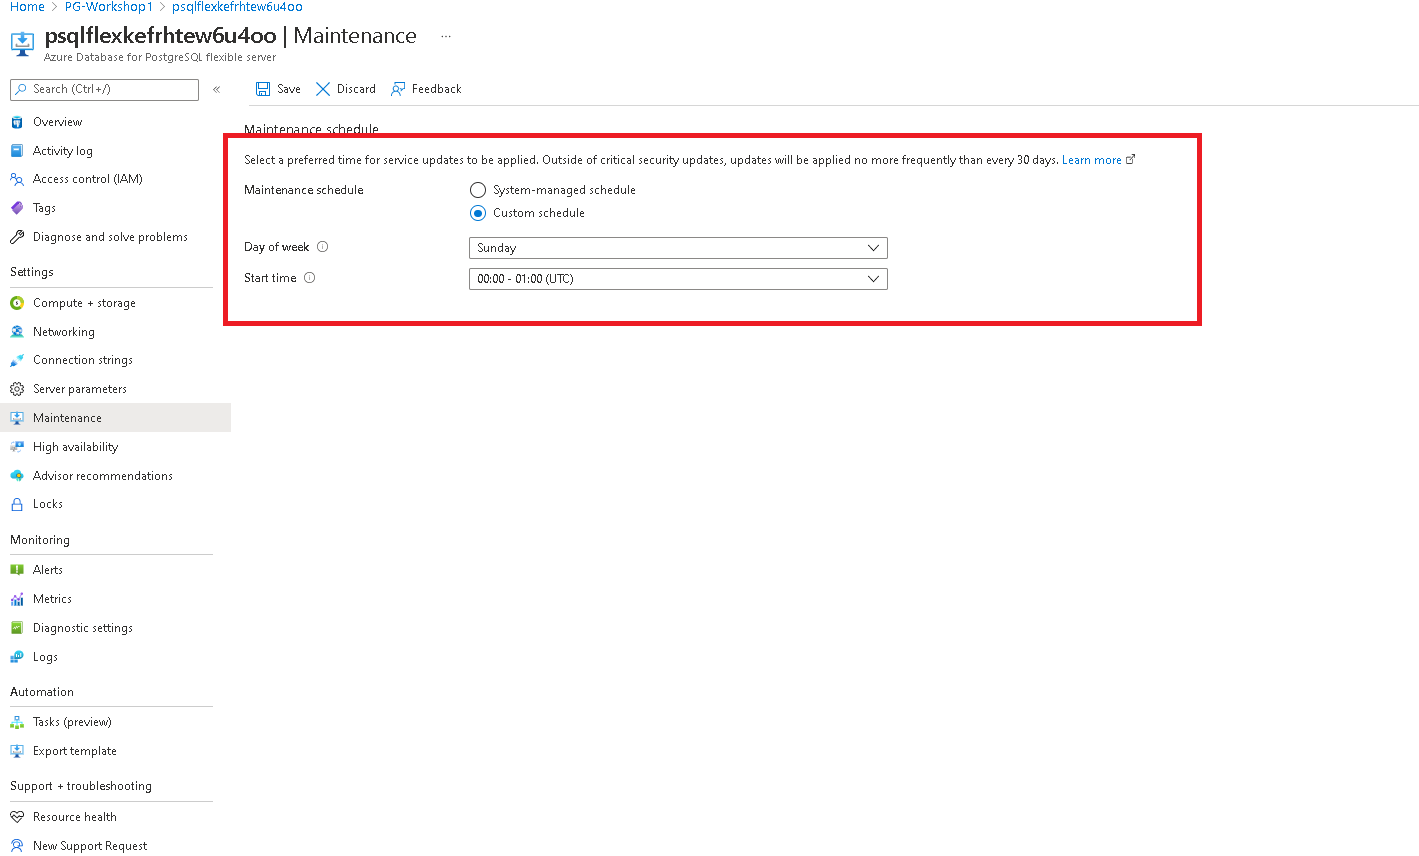
Click on save schedule to complete the configuration.
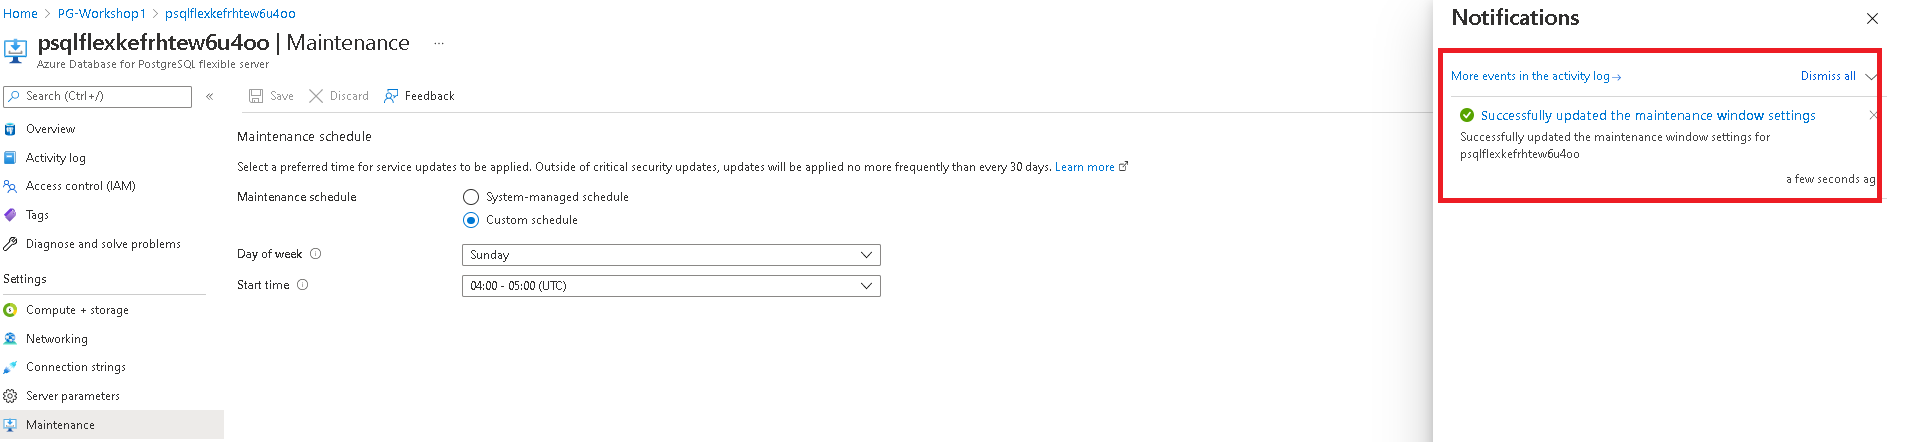
Using the Azure CLI
You can also configure the maintenance window via CLI:
az postgres flexible-server update \
--resource-group PG-Workshop \
--name <server-name> \
--maintenance-window "Sat:02:00"
Security Management
Installing pgAudit Extension
Audit logging of database activities in Azure Database for PostgreSQL - Flexible Server is available through the PostgreSQL Audit extension: pgAudit. It provides detailed session and/or object audit logging.
Step 1 — Allow the Extension
- In the Azure Portal, go to your PostgreSQL server → Server parameters
- Search for
azure.extensions - Enable pgaudit
- Click Save
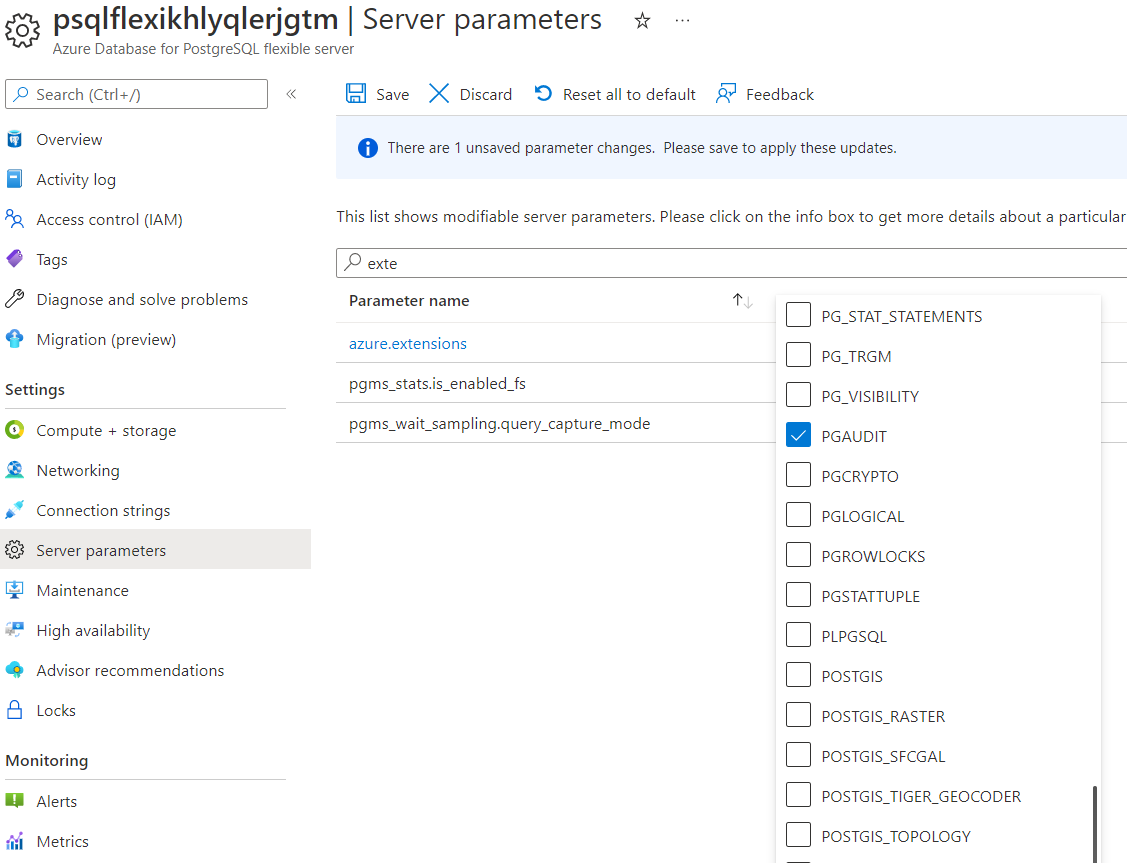
Step 2 — Add pgAudit to shared_preload_libraries
- In Server parameters, search for
shared_preload_libraries - Check pgaudit
- Click Save and Restart
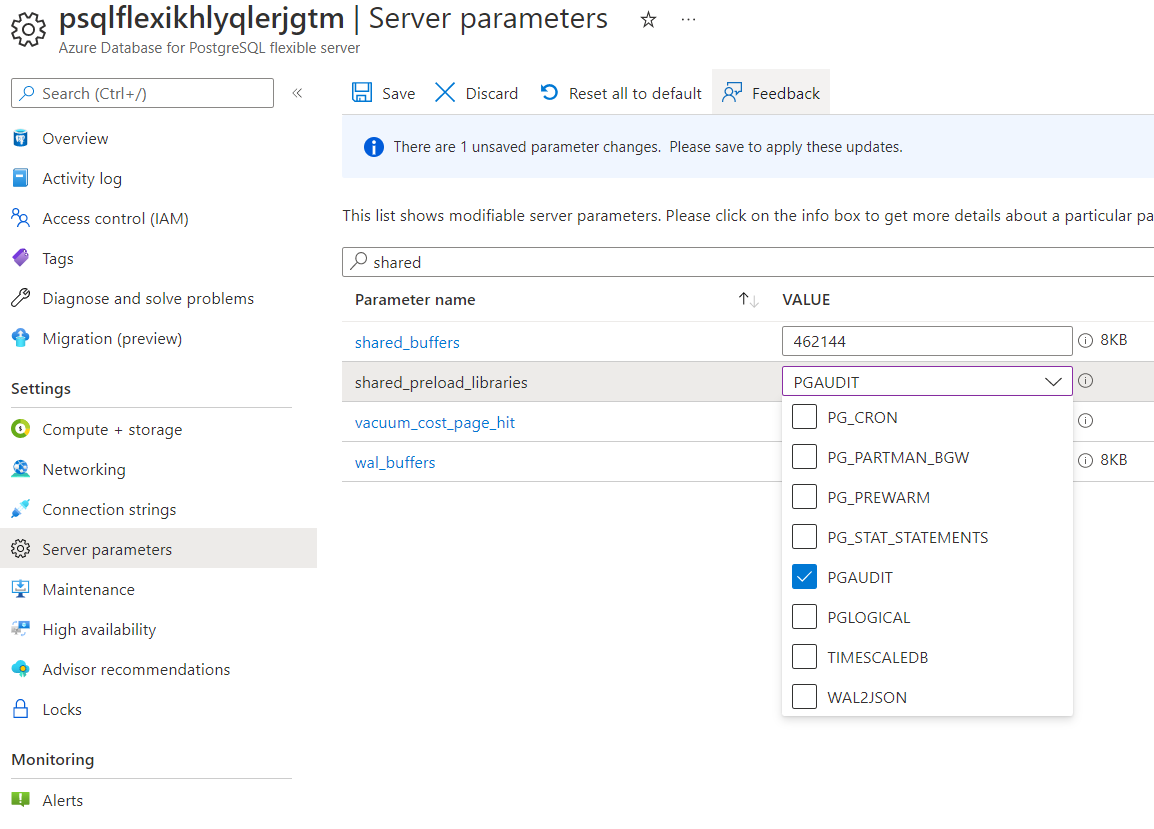
Step 3 — Create the Extension
Connect to your server from the jumpbox and enable the extension:
CREATE EXTENSION pgaudit;
Step 4 — Configure Audit Logging
- In Server parameters, search for
pgaudit.log - Change from
NONEtoALL(or select specific categories:READ,WRITE,DDL, etc.) - Click Save
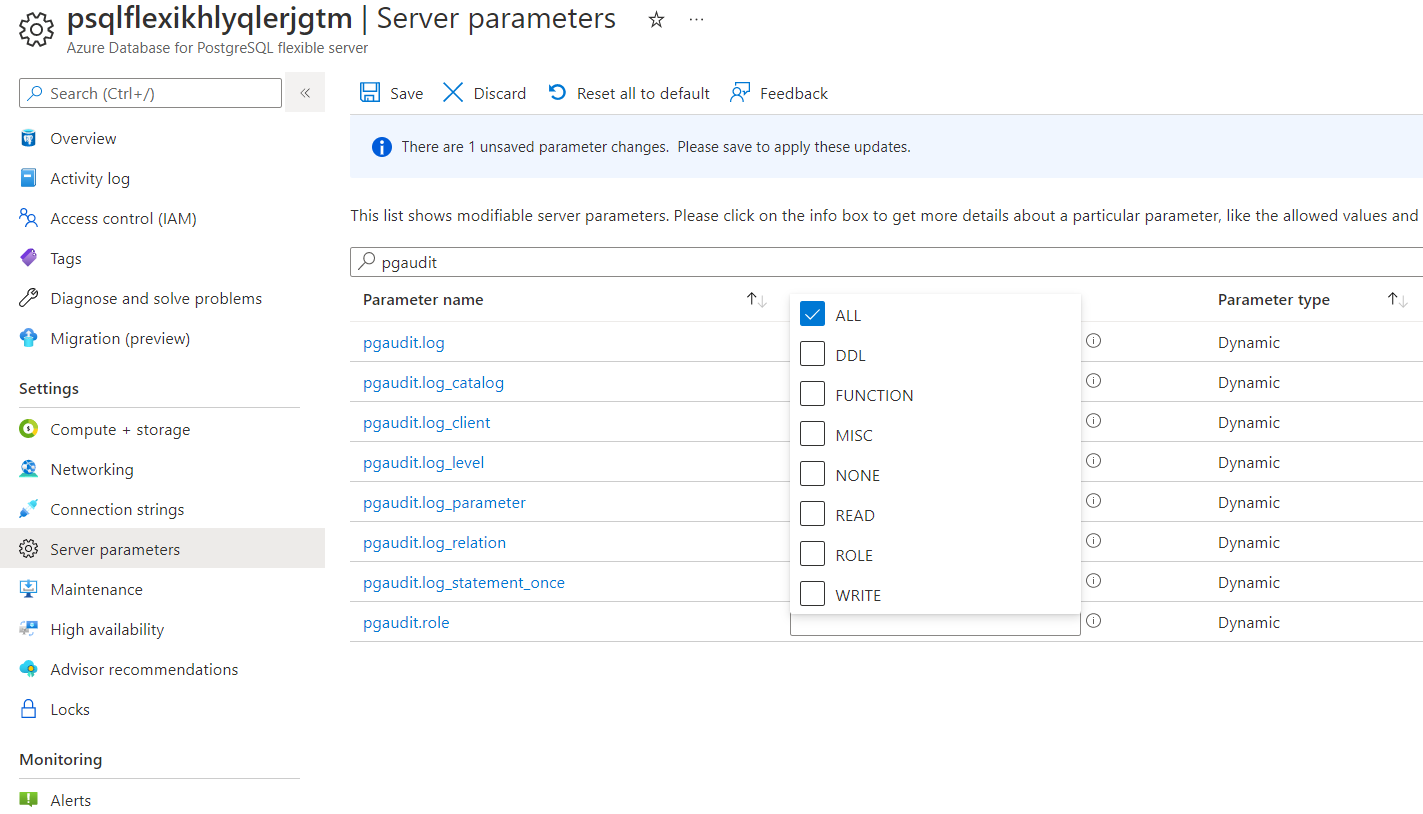
From this point, all database actions in your server are being audited.
Step 5 — Verify Audit Logging
Open a psql session and run some test commands:
CREATE TABLE audit_test(id int);
INSERT INTO audit_test SELECT generate_series(1, 100);
DROP TABLE audit_test;
Step 6 — View Audit Logs
Audit logs are sent to the Azure diagnostic logs pipeline. You can view them via:
Option A — Log Analytics (recommended):
- Go to your PostgreSQL server → Diagnostic settings
- Add a diagnostic setting that sends PostgreSQLLogs to a Log Analytics workspace
- Click Save
- After a few minutes, go to Logs in the left menu and run:
AzureDiagnostics
| where Category == "PostgreSQLLogs"
| where Message contains "AUDIT"
| project TimeGenerated, Message
| order by TimeGenerated desc
| take 50
Option B — Azure Portal Server Logs:
- Go to your PostgreSQL server → Logs (under Monitoring)
- Browse the recent log entries for
AUDIT:prefixed messages
Note: There is a 1–2 minute delay before log entries appear in Log Analytics.
Summary
| Concept | Key takeaway |
|---|---|
| pgAudit | Extension for detailed session/object audit logging |
| Diagnostic settings | Route PostgreSQL logs to Log Analytics, Storage Account, or Event Hub |
| Log Analytics | Query audit logs with KQL for compliance and security analysis |
Day Two Operations
Database Profiling & Activity Analysis
Audience: This section is aimed at developers and DBAs more than DevOps / Platform engineers. It focuses on understanding what the database is doing internally — session activity, vacuum health, cache efficiency, I/O patterns, lock contention, and query-level statistics. If you are coming from Oracle or SQL Server, each section includes a comparison box showing the equivalent concept in those platforms.
After running the demo workload in the previous section, this is where you learn to diagnose what happened. The queries below are organised into two scripts:
- Script A — Health Check: Run this periodically or after any change. It gives you a full picture of the database state.
- Script B — Performance Triage: Run this when someone says “the database is slow.” It focuses on active sessions, locks, I/O pressure, and the costliest queries.
Both scripts are designed to be copy-pasted into psql on the jumpbox. Every query targets PostgreSQL system catalog views — no extensions required unless noted.
Prepare Your psql Session
Before running any profiling query, configure psql for a clean output:
\pset pager off
\timing on
\x off
| Setting | What it does |
|---|---|
\pset pager off |
Prevents psql from piping long output through less / more — you see everything inline |
\timing on |
Prints execution time after every query — essential for spotting slow catalog queries |
\x off |
Uses normal tabular (horizontal) output. Switch to \x on for wide rows if needed |
Oracle comparison: In SQL*Plus you would use
SET PAGESIZE 0; SET TIMING ON; SET LINESIZE 200;SQL Server comparison: In SSMS, execution time appears in the status bar automatically. In
sqlcmd, use-eflag.
Script A — Health Check
Run this to understand the overall state of the database. None of these queries modify data.
A1 — Server Identity & Version
SELECT
version() AS server_version,
current_database() AS database_name,
current_user AS current_role,
inet_server_addr() AS server_ip,
inet_server_port() AS server_port,
now() AS checked_at;
What you learn: Confirms which server, database, and role you are connected to. The version() output includes the PostgreSQL major/minor version and the OS it was compiled on — useful for verifying you are on PG 18.
Example output:
server_version | database_name | current_role | server_ip | server_port | checked_at
---------------------------------------+---------------+--------------+-------------+-------------+---------------------------
PostgreSQL 18.1 on x86_64-pc-linux... | orders_demo | pgadmin | 10.1.2.4 | 5432 | 2026-03-19 14:30:00+00
Oracle:
SELECT * FROM v$version; SELECT ora_database_name FROM dual; SELECT user FROM dual;SQL Server:
SELECT @@VERSION; SELECT DB_NAME(); SELECT SUSER_SNAME();
A2 — Non-System Schemas
SELECT nspname AS schema_name
FROM pg_namespace
WHERE nspname NOT IN ('pg_catalog', 'information_schema')
AND nspname NOT LIKE 'pg_toast%'
AND nspname NOT LIKE 'pg_temp_%'
ORDER BY 1;
What you learn: Lists only the user-created schemas, filtering out PostgreSQL internals. In the orders_demo database you will see just public. In production systems you might see app, staging, audit, etc.
Why it matters: In PostgreSQL, the search_path determines which schema is queried by default. Misconfigured search paths are a common source of “table not found” errors.
Oracle: Schemas and users are the same thing —
SELECT username FROM all_users WHERE oracle_maintained = 'N';SQL Server:
SELECT name FROM sys.schemas WHERE schema_id > 4 AND schema_id < 16384;
A3 — Object Inventory by Schema & Type
SELECT
n.nspname AS schema_name,
CASE c.relkind
WHEN 'r' THEN 'table'
WHEN 'p' THEN 'partitioned table'
WHEN 'm' THEN 'materialised view'
WHEN 'v' THEN 'view'
WHEN 'S' THEN 'sequence'
WHEN 'i' THEN 'index'
END AS object_type,
COUNT(*) AS object_count
FROM pg_class c
JOIN pg_namespace n ON n.oid = c.relnamespace
WHERE n.nspname NOT IN ('pg_catalog', 'information_schema')
AND n.nspname NOT LIKE 'pg_toast%'
AND c.relkind IN ('r','p','m','v','S','i')
GROUP BY 1, 2
ORDER BY 1, 2;
What you learn: A quick summary of how many tables, partitioned tables, materialised views, views, sequences, and indexes exist in each user schema. This is the first thing to check when you connect to an unfamiliar database.
Example output for orders_demo:
schema_name | object_type | object_count
-------------+-------------+--------------
public | index | 4
public | sequence | 4
public | table | 4
Oracle:
SELECT owner, object_type, COUNT(*) FROM all_objects WHERE owner NOT IN ('SYS','SYSTEM') GROUP BY owner, object_type;SQL Server:
SELECT s.name, o.type_desc, COUNT(*) FROM sys.objects o JOIN sys.schemas s ON o.schema_id = s.schema_id WHERE o.is_ms_shipped = 0 GROUP BY s.name, o.type_desc;
A4 — Largest Relations (Heap + Index + TOAST breakdown)
SELECT
n.nspname AS schema_name,
c.relname AS relation_name,
CASE c.relkind WHEN 'r' THEN 'table' WHEN 'p' THEN 'partitioned' WHEN 'm' THEN 'matview' END AS type,
pg_size_pretty(pg_total_relation_size(c.oid)) AS total_size,
pg_size_pretty(pg_relation_size(c.oid)) AS heap_size,
pg_size_pretty(pg_indexes_size(c.oid)) AS index_size,
pg_size_pretty(
pg_total_relation_size(c.oid)
- pg_relation_size(c.oid)
- pg_indexes_size(c.oid)
) AS toast_and_overhead
FROM pg_class c
JOIN pg_namespace n ON n.oid = c.relnamespace
WHERE c.relkind IN ('r','p','m')
AND n.nspname NOT IN ('pg_catalog','information_schema')
ORDER BY pg_total_relation_size(c.oid) DESC
LIMIT 25;
What you learn: This goes beyond the basic size query from the previous section by breaking storage into three buckets:
- Heap — the actual table data on disk
- Index — all indexes attached to this table
- TOAST & overhead — large column values stored out-of-line (text, jsonb, bytea) plus free-space map and visibility map
If TOAST is large relative to heap, you likely have big text/JSON columns. If index size rivals heap size, you may have too many indexes.
Oracle:
SELECT segment_name, segment_type, bytes/1024/1024 MB FROM dba_segments ORDER BY bytes DESC;— Oracle stores data, indexes, and LOBs as separate segments.SQL Server:
EXEC sp_spaceused 'tablename';or querysys.dm_db_partition_stats. SQL Server separates in-row data, LOB data, and row-overflow data.
A5 — Row Estimates & Dead Tuple Pressure
SELECT
schemaname,
relname,
n_live_tup,
n_dead_tup,
ROUND(100.0 * n_dead_tup / NULLIF(n_live_tup + n_dead_tup, 0), 2) AS dead_pct,
last_autovacuum,
last_autoanalyze
FROM pg_stat_user_tables
ORDER BY n_dead_tup DESC
LIMIT 25;
What you learn: n_live_tup is the estimated number of live rows (updated by ANALYZE). n_dead_tup is the count of rows that have been deleted or updated but not yet vacuumed — they still occupy disk space.
Why dead_pct matters:
- < 5% — healthy, autovacuum is keeping up
- 5–20% — worth watching, consider lowering the autovacuum threshold for this table
- > 20% — autovacuum is behind or blocked; investigate immediately
Key PostgreSQL concept — MVCC dead tuples: PostgreSQL uses Multi-Version Concurrency Control (MVCC). When you
UPDATEa row, PG does not modify it in place — it creates a new version and marks the old one as dead.VACUUMlater reclaims the space.Oracle comparison: Oracle uses undo segments to store old row versions. Dead row versions live in undo, not in the table itself, so tables don’t bloat the same way. There is no
VACUUMin Oracle.SQL Server comparison: SQL Server uses tempdb-based row versioning (when READ_COMMITTED_SNAPSHOT is on) or lock-based isolation. Ghost records from deletes are cleaned by a background ghost cleanup task, but UPDATE is done in place — no dead tuple concept.
A6 — Vacuum & Analyze Health
SELECT
schemaname,
relname,
n_live_tup,
vacuum_count,
autovacuum_count,
last_vacuum,
last_autovacuum,
analyze_count,
autoanalyze_count,
last_analyze,
last_autoanalyze
FROM pg_stat_user_tables
ORDER BY last_autovacuum ASC NULLS FIRST
LIMIT 25;
What you learn: Shows how frequently vacuum and analyze have run on each table, and when they last ran. Tables that have never been autovacuumed (NULL timestamps) or have very old timestamps need attention.
How to read this:
vacuum_count/autovacuum_count— how many times the table has been vacuumed manually vs. automaticallyanalyze_count/autoanalyze_count— how many times statistics have been gathered- If
last_autoanalyzeis NULL or very old, the query planner is working with stale statistics — it will make bad execution plan choices
Practical tip: After restoring a dump, statistics are often empty. Run a manual analyze:
ANALYZE VERBOSE;
Oracle comparison: Oracle has automatic statistics gathering via the
DBMS_STATSpackage and maintenance windows. There is no separate vacuum step — undo management handles old versions.SQL Server comparison: SQL Server auto-updates statistics when ~20% of rows change (or lower with trace flag 2371). There is no vacuum equivalent — page splits and forwarding pointers are the closest analogy to bloat.
A7 — Read/Write Access Patterns
SELECT
schemaname,
relname,
seq_scan,
seq_tup_read,
idx_scan,
idx_tup_fetch,
n_tup_ins AS inserts,
n_tup_upd AS updates,
n_tup_del AS deletes,
n_tup_hot_upd AS hot_updates,
CASE WHEN (seq_scan + COALESCE(idx_scan, 0)) > 0
THEN ROUND(100.0 * COALESCE(idx_scan, 0) / (seq_scan + COALESCE(idx_scan, 0)), 2)
ELSE 0
END AS idx_scan_pct
FROM pg_stat_user_tables
ORDER BY (seq_tup_read + COALESCE(idx_tup_fetch, 0) + n_tup_ins + n_tup_upd + n_tup_del) DESC
LIMIT 25;
What you learn: The complete read/write profile of every table. This single query answers:
- Is this table read-heavy or write-heavy? Compare
seq_tup_read + idx_tup_fetchvs.inserts + updates + deletes - Are queries using indexes? If
idx_scan_pctis low and the table is large, you need indexes - Are HOT updates working?
hot_updatesmeans the update didn’t need to touch any index. A highhot_updatestoupdatesratio is good — it means PostgreSQL is efficiently updating in-place
What are HOT updates? When you update a column that is not part of any index, PostgreSQL can do a Heap-Only Tuple (HOT) update — the new row version stays on the same page and no index entries need updating. This is significantly faster.
Oracle comparison: Query
v$segment_statisticsfor logical reads, physical reads, and DML counts per segment. Oracle’s in-place update model means there’s no HOT equivalent.SQL Server comparison: Query
sys.dm_db_index_usage_statsfor seeks, scans, lookups, and updates per index. SQL Server’s forwarding pointer in heap tables is the closest pain point to non-HOT updates.
A8 — Unused or Low-Value Indexes
SELECT
s.schemaname,
s.relname AS table_name,
s.indexrelname AS index_name,
s.idx_scan,
pg_size_pretty(pg_relation_size(s.indexrelid)) AS index_size,
i.indexdef
FROM pg_stat_user_indexes s
JOIN pg_indexes i ON i.indexname = s.indexrelname AND i.schemaname = s.schemaname
WHERE s.idx_scan = 0
ORDER BY pg_relation_size(s.indexrelid) DESC
LIMIT 25;
What you learn: Indexes that have never been used since the last statistics reset. Every index has a cost:
- It consumes disk space
- Every INSERT/UPDATE/DELETE must update it
- It adds to vacuum workload
If an index has zero scans and takes significant space, it is a candidate for removal.
Caution: Always check pg_stat_database.stats_reset first — if stats were reset recently, a zero-scan count means nothing. Also check whether the index supports a UNIQUE or PK constraint before dropping.
-- When were stats last reset?
SELECT datname, stats_reset FROM pg_stat_database WHERE datname = current_database();
Oracle comparison:
SELECT * FROM dba_index_usage;(12c+) orv$object_usageafterALTER INDEX ... MONITORING USAGE;SQL Server comparison:
SELECT * FROM sys.dm_db_index_usage_stats WHERE user_seeks = 0 AND user_scans = 0 AND user_lookups = 0;
A9 — Database Throughput, Cache Hit Ratio & Deadlocks
SELECT
datname,
numbackends,
xact_commit,
xact_rollback,
ROUND(100.0 * xact_rollback / NULLIF(xact_commit + xact_rollback, 0), 2) AS rollback_pct,
blks_read,
blks_hit,
ROUND(100.0 * blks_hit / NULLIF(blks_hit + blks_read, 0), 2) AS cache_hit_pct,
tup_returned,
tup_fetched,
tup_inserted,
tup_updated,
tup_deleted,
temp_files,
pg_size_pretty(temp_bytes) AS temp_bytes,
deadlocks,
blk_read_time,
blk_write_time,
parallel_workers_to_launch,
parallel_workers_launched,
stats_reset
FROM pg_stat_database
WHERE datname = current_database();
What you learn: A single-row dashboard of your database’s lifetime activity:
| Metric | Healthy range | What to do if unhealthy |
|---|---|---|
cache_hit_pct |
> 99% | Increase shared_buffers; check for sequential scans on large tables |
rollback_pct |
< 1% | Investigate application error handling — are transactions failing? |
temp_files / temp_bytes |
Low or zero | Increase work_mem to avoid sorts spilling to disk |
deadlocks |
0 | Review transaction ordering in application code |
blk_read_time / blk_write_time |
Only visible if track_io_timing = on |
High values indicate slow storage |
parallel_workers_launched vs _to_launch |
Close to equal | Large gap means max_parallel_workers or max_parallel_workers_per_gather is too low |
Key concept — shared_buffers & cache hit ratio:
PostgreSQL reads data into shared_buffers (a shared memory cache, typically 25% of RAM). The cache hit ratio measures what percentage of block reads were served from this cache rather than going to disk. On Azure Flexible Server, the default is usually well-tuned, but workloads with large sequential scans can blow the cache.
Oracle comparison:
SELECT * FROM v$sysstat WHERE name LIKE '%buffer cache%';— Oracle’s buffer cache hit ratio is conceptually identical. Oracle also hasv$system_eventfor wait-based I/O analysis.SQL Server comparison:
SELECT * FROM sys.dm_os_performance_counters WHERE counter_name LIKE '%Buffer cache hit ratio%';— same concept. SQL Server also exposesdm_exec_query_statsfor query-level I/O.
A10 — WAL, Checkpoint & Background Writer
Note:
\echois a psql meta-command used here as a section label. The SQL queries below it run normally.
\echo '--- WAL generation ---' -- meta-command: prints a label
SELECT
wal_records,
wal_fpi,
wal_bytes,
pg_size_pretty(wal_bytes) AS wal_bytes_pretty,
wal_buffers_full,
stats_reset
FROM pg_stat_wal;
\echo '--- WAL I/O timing (from pg_stat_io) ---'
SELECT
backend_type,
writes,
write_time,
fsyncs,
fsync_time
FROM pg_stat_io
WHERE object = 'wal'
ORDER BY writes DESC NULLS LAST;
\echo '--- Checkpoint activity ---' -- meta-command: prints a label
SELECT * FROM pg_stat_checkpointer;
\echo '--- Background writer ---' -- meta-command: prints a label
SELECT * FROM pg_stat_bgwriter;
What you learn:
WAL (Write-Ahead Log): Every data change in PostgreSQL is first written to the WAL before being applied to data files. This is the crash-recovery mechanism. High wal_fpi (full-page images) right after a checkpoint is normal — it’s PostgreSQL writing complete page images to protect against torn writes. wal_buffers_full counts how often WAL data had to be flushed to disk because the WAL buffers ran out of space — a high value suggests increasing wal_buffers.
Note (PG 17+): WAL write/sync counts and timing moved from
pg_stat_waltopg_stat_io(whereobject = 'wal'). The second query above shows those per-backend-type I/O stats. Enabletrack_wal_io_timing = onto populate the timing columns.
Checkpoints: Periodically, PostgreSQL flushes all dirty pages from shared_buffers to disk. This is a checkpoint. Frequent checkpoints mean more I/O spikes; infrequent checkpoints mean longer crash recovery. Look at write_time and sync_time in pg_stat_checkpointer — if these are high, your storage is struggling.
Background writer: Continuously writes dirty pages to disk so that checkpoints have less work to do. If buffers_alloc is much larger than buffers_clean, the background writer is not keeping up.
Oracle comparison: Oracle’s redo log = WAL.
v$log,v$archived_logfor redo stats. DBWR (database writer) = background writer + checkpointer combined.v$bgprocessshows background processes.SQL Server comparison: SQL Server’s transaction log = WAL.
sys.dm_io_virtual_file_statsfor log I/O. Checkpoint occurs automatically via the recovery interval setting. Lazy writer = closest analogy to the background writer.
A11 — Replication Status
\echo '--- Active replication connections (primary only) ---' -- meta-command: prints a label
SELECT
pid,
usename,
application_name,
client_addr,
state,
sent_lsn,
write_lsn,
flush_lsn,
replay_lsn,
pg_size_pretty(pg_wal_lsn_diff(sent_lsn, replay_lsn)) AS replication_lag
FROM pg_stat_replication;
\echo '--- Replication slots ---' -- meta-command: prints a label
SELECT
slot_name,
slot_type,
active,
pg_size_pretty(pg_wal_lsn_diff(pg_current_wal_lsn(), restart_lsn)) AS retained_wal
FROM pg_replication_slots;
What you learn: If your Flexible Server has read replicas, this shows the replication lag (how far behind each replica is). The retained_wal column shows how much WAL is being kept for each slot — inactive slots that retain a lot of WAL can fill your storage.
If you do not have read replicas configured, these will return empty results. That is expected.
Oracle comparison:
v$managed_standby,v$dataguard_stats, Data Guard broker.SQL Server comparison:
sys.dm_hadr_database_replica_statesfor Always On AG lag.
A12 — Monitoring Settings Check
SELECT name, setting, unit, short_desc
FROM pg_settings
WHERE name IN (
'track_io_timing',
'track_wal_io_timing',
'track_activities',
'track_counts',
'track_functions',
'compute_query_id',
'log_min_duration_statement',
'shared_preload_libraries'
)
ORDER BY name;
What you learn: Confirms that the telemetry parameters needed for profiling are enabled:
| Setting | Expected | Why |
|---|---|---|
track_io_timing |
on |
Enables blk_read_time / blk_write_time in pg_stat_database and pg_stat_io |
track_wal_io_timing |
on |
Enables WAL write/sync timing in pg_stat_io (where object = 'wal') |
track_activities |
on |
Required for pg_stat_activity to show current queries |
track_counts |
on |
Required for pg_stat_user_tables counters |
compute_query_id |
on or auto |
Required for pg_stat_statements query grouping |
shared_preload_libraries |
Contains pg_stat_statements |
The extension must be preloaded at startup |
If any of these are off, profiling data will be incomplete. On Azure Flexible Server, most are on by default, but verify.
A13 — Installed Extensions
SELECT extname, extversion
FROM pg_extension
ORDER BY extname;
Check specifically for pg_stat_statements — you will need it in Script B.
If it’s missing, create it (requires azure_pg_admin or equivalent):
CREATE EXTENSION IF NOT EXISTS pg_stat_statements;
Script B — Performance Triage
Run this when the complaint is “the database is slow.” These queries focus on live activity, contention, and the heaviest queries.
B1 — Active Sessions Ordered by Age
SELECT
pid,
usename,
application_name,
client_addr,
backend_type,
state,
wait_event_type,
wait_event,
now() - xact_start AS xact_age,
now() - query_start AS query_age,
LEFT(query, 200) AS query
FROM pg_stat_activity
WHERE pid <> pg_backend_pid()
ORDER BY xact_age DESC NULLS LAST, query_age DESC NULLS LAST;
What you learn: Every session connected to the server, sorted by how long the oldest transaction has been open. This is the first thing to check when the database feels slow.
How to read the state column:
| State | Meaning |
|---|---|
active |
Currently executing a query |
idle |
Connected but doing nothing — harmless in small numbers |
idle in transaction |
Danger — an open transaction holding locks but not running a query. Blocks vacuum and can cause bloat |
idle in transaction (aborted) |
A failed transaction that was never rolled back. Application bug. |
What to look for:
- Any session in
idle in transactionfor more than a few seconds — contact the application owner - Very old
xact_agewithactivestate — a long-running query that may be blocking others wait_event_type = Lock— the session is waiting for a lock held by another session
Oracle comparison:
SELECT * FROM v$session WHERE status = 'ACTIVE';or usev$session_longopsfor long-running operations.SQL Server comparison:
SELECT * FROM sys.dm_exec_requests r JOIN sys.dm_exec_sessions s ON r.session_id = s.session_id;or usesp_who2.
B2 — Sessions Waiting on Locks or I/O
SELECT
pid,
usename,
application_name,
state,
wait_event_type,
wait_event,
now() - query_start AS wait_age,
LEFT(query, 200) AS query
FROM pg_stat_activity
WHERE wait_event_type IS NOT NULL
AND state = 'active'
AND pid <> pg_backend_pid()
ORDER BY wait_age DESC NULLS LAST;
What you learn: Filters to only sessions that are actively waiting on something — a lock, disk I/O, network, or an internal latch. This immediately narrows down the bottleneck.
Common wait_event_type values:
| Type | Meaning | Action |
|---|---|---|
Lock |
Waiting for a row/table lock | Find the blocker (B3 below) |
IO |
Waiting for a disk read/write | Check storage latency, IOPS limits |
LWLock |
Internal lightweight lock (buffer, WAL, etc.) | Often a shared_buffers contention issue |
BufferPin |
Waiting for a buffer page to be released | Usually correlates with vacuum contention |
Client |
Waiting for the client to send data | Application or network issue, not a DB problem |
Oracle comparison:
v$session.event,v$session_wait— Oracle’s wait interface is the gold standard for this kind of debugging.SQL Server comparison:
sys.dm_os_waiting_tasksandsys.dm_exec_requests.wait_type.
B3 — Blocking Chains
SELECT
a.pid AS waiting_pid,
a.usename AS waiting_user,
pg_blocking_pids(a.pid) AS blocking_pids,
now() - a.query_start AS waiting_for,
LEFT(a.query, 150) AS waiting_query,
(SELECT LEFT(query, 150) FROM pg_stat_activity WHERE pid = (pg_blocking_pids(a.pid))[1]) AS blocker_query
FROM pg_stat_activity a
WHERE cardinality(pg_blocking_pids(a.pid)) > 0
ORDER BY waiting_for DESC;
What you learn: Who is blocked, who is blocking them, and what both sides are doing. The added blocker_query column shows you the query that the blocking session is running (or the last query it ran if it’s idle in transaction).
How to resolve:
- If the blocker is
idle in transaction, the application likely forgot toCOMMITorROLLBACK. Contact the app owner or terminate the session:
SELECT pg_terminate_backend(<blocking_pid>);
- If the blocker is running a legitimate long query, you may need to wait or cancel it:
SELECT pg_cancel_backend(<blocking_pid>); -- cancels current query, keeps connection
Oracle comparison:
SELECT * FROM dba_blockers; SELECT * FROM dba_waiters;or usev$lockwith self-joins.SQL Server comparison:
sp_who2showsBlkBycolumn. More detail viasys.dm_tran_locksandsys.dm_os_waiting_tasks.
B4 — I/O Breakdown by Backend & Object (PostgreSQL 16+)
SELECT
backend_type,
object,
context,
reads,
pg_size_pretty(read_bytes) AS read_bytes,
writes,
pg_size_pretty(write_bytes) AS write_bytes,
extends,
pg_size_pretty(extend_bytes) AS extend_bytes,
fsyncs
FROM pg_stat_io
ORDER BY read_bytes DESC NULLS LAST, write_bytes DESC NULLS LAST
LIMIT 30;
What you learn: pg_stat_io (introduced in PostgreSQL 16) shows I/O at a granular level — broken down by which backend type (client backend, autovacuum, checkpointer, etc.) is doing the I/O, and which object type (relation, temp, WAL) is being read/written.
Example insights:
- If
autovacuum workershows high write bytes, vacuum is doing a lot of work — probably cleaning up dead tuples from your workload - If
client backendshows high read bytes with contextnormal, your queries are reading heap pages (possibly sequential scans) - If
checkpointershows high write + fsync, checkpoints are expensive — consider increasingcheckpoint_timeout
This view has no equivalent in Oracle or SQL Server. Oracle’s
v$iostat_functionis the closest (I/O by function like DBWR, LGWR). SQL Server’ssys.dm_io_virtual_file_statsis per-file, not per-backend.
B5 — Tables with Highest Write Churn
SELECT
schemaname,
relname,
n_tup_ins AS inserts,
n_tup_upd AS updates,
n_tup_del AS deletes,
n_tup_hot_upd AS hot_updates,
CASE WHEN n_tup_upd > 0
THEN ROUND(100.0 * n_tup_hot_upd / n_tup_upd, 2)
ELSE 0
END AS hot_pct,
n_live_tup,
n_dead_tup,
last_autovacuum
FROM pg_stat_user_tables
ORDER BY (n_tup_ins + n_tup_upd + n_tup_del) DESC
LIMIT 20;
What you learn: Which tables are under the most write pressure, and whether HOT updates are working effectively.
Reading hot_pct:
- > 80% — excellent, most updates are heap-only
- < 50% — every update is also updating index entries; consider whether all indexes on this table are necessary
- 0% — every updated column is indexed; this is expensive
B6 — Standby Conflict Summary
SELECT *
FROM pg_stat_database_conflicts
WHERE datname = current_database();
What you learn: On a standby/replica, shows how many queries were cancelled due to conflicts with WAL replay. The columns (confl_tablespace, confl_lock, confl_snapshot, confl_bufferpin, confl_deadlock, confl_active_logicalslot) tell you why the conflict occurred.
On a primary without read replicas, all values will be 0. This matters when you add read replicas.
B7 — Top Queries by Execution Time (pg_stat_statements)
This requires the
pg_stat_statementsextension. If you haven’t enabled it yet, see section A13.
SELECT
calls,
ROUND(total_exec_time::numeric, 2) AS total_ms,
ROUND(mean_exec_time::numeric, 2) AS mean_ms,
ROUND(min_exec_time::numeric, 2) AS min_ms,
ROUND(max_exec_time::numeric, 2) AS max_ms,
rows,
shared_blks_hit,
shared_blks_read,
CASE WHEN (shared_blks_hit + shared_blks_read) > 0
THEN ROUND(100.0 * shared_blks_hit / (shared_blks_hit + shared_blks_read), 2)
ELSE 0
END AS cache_hit_pct,
temp_blks_written,
LEFT(query, 200) AS query
FROM pg_stat_statements
ORDER BY total_exec_time DESC
LIMIT 20;
What you learn: The top 20 most expensive queries by cumulative execution time. This is the single most valuable profiling query in PostgreSQL.
How to read it:
| Column | What it tells you |
|---|---|
calls |
How many times this query ran |
total_ms |
Cumulative execution time across all calls |
mean_ms |
Average time per call |
min_ms / max_ms |
Best and worst case — a big gap means variable performance |
cache_hit_pct |
Per-query cache efficiency — low values mean this query is doing disk I/O |
temp_blks_written |
Non-zero means the query spilled to temp files — increase work_mem or fix the query |
Practical workflow:
- Run the demo workload from the previous section
- Run this query
- You will see the 6 heavy queries at the top of the list
- Note the
mean_ms— this is your baseline - Later, add indexes and re-run to see the improvement
To reset statistics and start fresh:
SELECT pg_stat_statements_reset();
Oracle comparison:
v$sqlordered byelapsed_time— nearly identical concept. Oracle’s AWR/ASH reports automate this.SQL Server comparison:
sys.dm_exec_query_statsordered bytotal_worker_time. Query Store (sys.query_store_runtime_stats) provides historical tracking.
B8 — Top Queries by I/O (reads from disk)
SELECT
calls,
shared_blks_read,
shared_blks_hit,
ROUND(total_exec_time::numeric, 2) AS total_ms,
temp_blks_read + temp_blks_written AS temp_blks_total,
LEFT(query, 200) AS query
FROM pg_stat_statements
ORDER BY shared_blks_read DESC
LIMIT 20;
What you learn: Queries sorted by physical reads — these are the queries forcing the most disk I/O. A query might be fast per execution but if it reads many blocks and runs thousands of times, it saturates your storage.
B9 — Top Queries by Temp File Usage
SELECT
calls,
temp_blks_written,
pg_size_pretty(temp_blks_written * 8192) AS temp_written,
ROUND(mean_exec_time::numeric, 2) AS mean_ms,
rows,
LEFT(query, 200) AS query
FROM pg_stat_statements
WHERE temp_blks_written > 0
ORDER BY temp_blks_written DESC
LIMIT 20;
What you learn: Queries that spill sort/hash data to temp files on disk. Each temp block is 8 KB. This is almost always fixable by:
- Increasing
work_mem(per-session setting) - Adding an appropriate index so the sort is avoided
- Rewriting the query (e.g., replacing a correlated subquery with a JOIN)
PostgreSQL vs Oracle vs SQL Server — Quick Reference
For developers migrating from Oracle or SQL Server, here is a mapping of the key profiling concepts:
| Concept | PostgreSQL | Oracle | SQL Server |
|---|---|---|---|
| System views prefix | pg_stat_*, pg_catalog.* |
v$*, dba_* |
sys.dm_*, sys.* |
| Current sessions | pg_stat_activity |
v$session |
sys.dm_exec_sessions |
| Active queries | pg_stat_activity (state = active) |
v$sql, v$session_longops |
sys.dm_exec_requests |
| Query statistics | pg_stat_statements (extension) |
v$sql (built-in) |
Query Store / dm_exec_query_stats |
| Table I/O stats | pg_stat_user_tables |
v$segment_statistics |
dm_db_index_usage_stats |
| Buffer cache hit | pg_stat_database.blks_hit |
v$sysstat buffer cache |
dm_os_performance_counters |
| Locks / blocking | pg_locks, pg_blocking_pids() |
v$lock, dba_waiters |
dm_tran_locks, dm_os_waiting_tasks |
| Wait events | pg_stat_activity.wait_event |
v$session_wait |
dm_os_wait_stats |
| I/O by backend | pg_stat_io (PG16+) |
v$iostat_function |
dm_io_virtual_file_stats |
| WAL / Redo / TLog | pg_stat_wal, pg_stat_io (object=wal) |
v$log, v$archived_log |
dm_io_virtual_file_stats (log file) |
| Vacuum (dead rows) | pg_stat_user_tables, VACUUM |
N/A (undo-based) | N/A (in-place updates) |
| Index usage | pg_stat_user_indexes |
dba_index_usage (12c+) |
dm_db_index_usage_stats |
| Execution plans | EXPLAIN (ANALYZE, BUFFERS) |
EXPLAIN PLAN / DBMS_XPLAN |
SET STATISTICS PROFILE ON / Plan Cache |
| Kill a query | pg_cancel_backend(pid) |
ALTER SYSTEM KILL SESSION |
KILL <spid> |
| Kill a session | pg_terminate_backend(pid) |
ALTER SYSTEM KILL SESSION |
KILL <spid> |
Practical Tips & Recommendations
Tip 1 — Save the scripts as files
Instead of copy-pasting every time, save the scripts on the jumpbox and run them with:
# Save Script A
cat > health_check.sql << 'EOF'
\pset pager off
\timing on
-- paste the queries here
EOF
# Run it
psql -h <fqdn> -U <pgadmin> -d orders_demo -f health_check.sql
Tip 2 — Use EXPLAIN (ANALYZE, BUFFERS, FORMAT TEXT) for individual queries
When you find a slow query via pg_stat_statements, examine its execution plan:
EXPLAIN (ANALYZE, BUFFERS, FORMAT TEXT)
SELECT c.city, c.country, p.category,
COUNT(DISTINCT o.order_id) AS total_orders
FROM customers c
JOIN orders o ON o.customer_id = c.customer_id
JOIN order_items oi ON oi.order_id = o.order_id
JOIN products p ON p.product_id = oi.product_id
GROUP BY c.city, c.country, p.category;
ANALYZE— actually runs the query and shows real timings (not just estimates)BUFFERS— shows how many buffer cache hits vs. disk reads each step caused
Warning:
EXPLAIN ANALYZEexecutes the query. ForINSERT/UPDATE/DELETE, wrap in a transaction and roll back:BEGIN; EXPLAIN (ANALYZE, BUFFERS) DELETE FROM orders WHERE status = 'cancelled'; ROLLBACK;
Tip 3 — Use auto_explain for production profiling
Instead of manually running EXPLAIN, you can configure PostgreSQL to automatically log execution plans for slow queries:
-- Check if auto_explain is available
SHOW shared_preload_libraries;
-- Configure via server parameters in Azure Portal:
-- auto_explain.log_min_duration = 1000 (log plans for queries > 1 second)
-- auto_explain.log_analyze = on
-- auto_explain.log_buffers = on
Plans appear in the PostgreSQL logs — view them via Azure Diagnostic Settings → Log Analytics or download the log files from the Azure Portal.
Tip 4 — Reset statistics between test runs
When benchmarking query improvements, reset statistics so you get a clean comparison:
-- Reset per-table stats
SELECT pg_stat_reset();
-- Reset pg_stat_statements
SELECT pg_stat_statements_reset();
-- Reset pg_stat_io
SELECT pg_stat_reset_shared('io');
Tip 5 — Consider pgBench for structured load testing
The demo queries in the previous section are great for ad-hoc load, but for repeatable benchmarks, use pgbench (part of postgresql18-contrib — if you followed the Connection Pooling section, it is already installed):
# Initialise pgbench tables (scale factor 50 ≈ 5M rows)
pgbench -i -s 50 -h <fqdn> -U <pgadmin> -d orders_demo
# Run a 60-second benchmark with 4 clients
pgbench -c 4 -j 4 -T 60 -h <fqdn> -U <pgadmin> -d orders_demo
This gives you standardised TPS (transactions per second) numbers you can compare before and after tuning changes.
Further Reading & Resources
| Resource | Link | Description |
|---|---|---|
| PostgreSQL Official Monitoring Docs | postgresql.org/docs/current/monitoring-stats.html | Complete reference for all pg_stat_* views |
| pg_stat_statements Docs | postgresql.org/docs/current/pgstatstatements.html | Extension reference — query normalisation, configuration, reset |
| pg_stat_io Docs (PG16+) | postgresql.org/docs/current/monitoring-stats.html#MONITORING-PG-STAT-IO-VIEW | The I/O breakdown view |
| Azure Flexible Server Monitoring | learn.microsoft.com/azure/postgresql/flexible-server/concepts-monitoring | Azure-specific metrics, Query Performance Insight |
| EXPLAIN Visualiser (depesz) | explain.depesz.com | Paste EXPLAIN ANALYZE output for a visual breakdown |
| Azure Log Analytics | learn.microsoft.com/azure/postgresql/flexible-server/howto-configure-and-access-logs | Stream and query PostgreSQL logs from the Azure Portal |
| The Art of PostgreSQL | theartofpostgresql.com | Book aimed at developers migrating from other databases |
| pgbench Documentation | postgresql.org/docs/current/pgbench.html | Built-in benchmarking tool reference |
Multiversion Concurrency Control (MVCC)
PostgreSQL never overwrites data in place. When you UPDATE a row, it creates a new version of that row and marks the old one as “dead.” When you DELETE a row, it marks the existing version as dead. The dead versions remain on disk until VACUUM reclaims the space.
This mechanism is called MVCC (Multi-Version Concurrency Control) and it is what allows PostgreSQL to serve reads and writes concurrently without locking.
Why this matters: If you don’t understand MVCC, you will be surprised when tables grow far larger than the data they contain, when
DELETEdoesn’t free disk space, and when autovacuum becomes critical infrastructure rather than a nice-to-have.
How MVCC Works — A Visual Explanation

VACUUM is not optional maintenance — it is core infrastructure. Unlike Oracle or SQL Server, PostgreSQL never overwrites rows in place. Every
UPDATEappends a new row version; everyDELETEjust marks the current version as dead. Over time, heavily-updated tables accumulate thousands of dead versions that bloat your storage, slow down sequential scans, and make index maintenance more expensive.autovacuumhandles this automatically, but it must be tuned for large or fast-changing tables — the defaults are optimised for small databases, not production workloads.
Golden rule: if autovacuum cannot keep up with dead tuple growth, table size will grow unboundedly even if row count stays constant.
Key fields on every row (system columns):
| Column | Meaning |
|---|---|
xmin |
The transaction ID that created this row version |
xmax |
The transaction ID that deleted or replaced this row version. 0 means it is still live. |
ctid |
The physical location of the row on disk (page, offset) |
You can query these directly:
SELECT ctid, xmin, xmax, customer_id, first_name
FROM customers
LIMIT 5;
How This Differs from Oracle and SQL Server
| Aspect | PostgreSQL | Oracle | SQL Server |
|---|---|---|---|
| UPDATE | Creates a new row version in the same table | Updates the row in place; old version goes to undo segment | Updates the row in place; old version goes to tempdb (if snapshot isolation on) |
| Dead rows | Stay in the table until VACUUM | Stored in undo; auto-managed by undo retention | Stored in tempdb version store; auto-cleaned |
| Table bloat | Yes — table grows if vacuum doesn’t keep up | No — undo is separate storage | No — tempdb absorbs versioning |
| Space reclaim | VACUUM (regular) or VACUUM FULL (rewrites table) |
Automatic (undo segments recycle) | Automatic |
| Background process | autovacuum — must be running and tuned | Not needed for space reclaim | Ghost cleanup task |
The fundamental insight: In PostgreSQL, an UPDATE is essentially a DELETE + INSERT. This has massive implications for table size, index maintenance, and performance.
Hands-On Lab — Observing MVCC with the orders_demo Database
We will use the orders_demo database from the workload section to observe MVCC in action on a realistic dataset.
Connect to the database:
psql -h <postgresql-fqdn> -U <pgadmin> -d orders_demo
Enable timing:
\timing
Step 1 — Baseline: Measure Table Size and Dead Tuples
SELECT
relname,
pg_size_pretty(pg_relation_size(relid)) AS table_size,
n_live_tup,
n_dead_tup,
last_autovacuum
FROM pg_stat_user_tables
WHERE relname IN ('customers', 'orders', 'order_items')
ORDER BY pg_relation_size(relid) DESC;
Record the current sizes. If autovacuum has been running (which it should be), n_dead_tup should be low.
Step 2 — Disable Autovacuum
To clearly observe the effect of dead tuples, temporarily disable autovacuum through the Azure Portal:
- Go to your PostgreSQL Flexible Server → Server parameters
- Search for
autovacuum - Set it to OFF
- Click Save
Warning: Never disable autovacuum in production. We are doing this only to demonstrate what happens when dead tuples accumulate.
Verify from psql:
SHOW autovacuum;
Expected: off
Step 3 — Generate Dead Tuples via UPDATE
Let’s update all 10,000 customers — adding 10 loyalty points to each:
UPDATE customers SET loyalty_points = loyalty_points + 10;
Now check the impact:
SELECT
relname,
pg_size_pretty(pg_relation_size(relid)) AS table_size,
n_live_tup,
n_dead_tup
FROM pg_stat_user_tables
WHERE relname = 'customers';
You should see:
n_live_tup≈ 10,000 (the new row versions)n_dead_tup≈ 10,000 (the old row versions — still on disk)- Table size has grown — PostgreSQL had to write 10,000 new rows without reclaiming the old ones
Run the UPDATE again:
UPDATE customers SET loyalty_points = loyalty_points + 10;
Check again:
SELECT
relname,
pg_size_pretty(pg_relation_size(relid)) AS table_size,
n_live_tup,
n_dead_tup
FROM pg_stat_user_tables
WHERE relname = 'customers';
Now n_dead_tup ≈ 20,000 — two rounds of dead rows. The table has grown further even though it still represents the same 10,000 customers.
Step 4 — See Dead Tuples with System Columns
Query the system columns directly to see multiple versions:
SELECT ctid, xmin, xmax, customer_id, loyalty_points
FROM customers
WHERE customer_id = 1;
You will see only the live version (xmax = 0). The dead versions are invisible to normal queries — that’s the whole point of MVCC (readers don’t see uncommitted or dead rows).
To see how much space dead rows occupy, check the page count:
SELECT
relpages AS pages_on_disk,
pg_size_pretty(pg_relation_size('customers')) AS size,
reltuples::bigint AS estimated_live_rows
FROM pg_class
WHERE relname = 'customers';
Compare relpages to what it was in Step 1 — it should be significantly larger.
Step 5 — Observe the Impact of DELETE
Delete half the orders (those with status = ‘cancelled’ or ‘returned’):
SELECT status, COUNT(*) FROM orders GROUP BY status;
DELETE FROM order_items
WHERE order_id IN (SELECT order_id FROM orders WHERE status IN ('cancelled', 'returned'));
DELETE FROM orders WHERE status IN ('cancelled', 'returned');
Check the damage:
SELECT
relname,
pg_size_pretty(pg_relation_size(relid)) AS table_size,
n_live_tup,
n_dead_tup,
ROUND(100.0 * n_dead_tup / NULLIF(n_live_tup + n_dead_tup, 0), 1) AS dead_pct
FROM pg_stat_user_tables
WHERE relname IN ('orders', 'order_items')
ORDER BY relname;
The tables still occupy the same disk space (or more) even though rows have been deleted. dead_pct may be 20–40%.
Step 6 — VACUUM (Regular)
Run a regular VACUUM and observe what changes:
VACUUM VERBOSE customers;
What VACUUM does:
- Scans the table for dead row versions
- Marks the space they occupy as reusable (available for future INSERTs/UPDATEs)
- Optionally truncates empty pages at the end of the file
SELECT
relname,
pg_size_pretty(pg_relation_size(relid)) AS table_size,
n_live_tup,
n_dead_tup
FROM pg_stat_user_tables
WHERE relname = 'customers';
After VACUUM:
n_dead_tup→ 0- Table size may NOT shrink — regular VACUUM marks space as reusable but doesn’t return it to the OS (unless trailing empty pages can be truncated)
This is a critical distinction: VACUUM reclaims space within the table for reuse. It does NOT shrink the file.
Step 7 — VACUUM FULL (Table Rewrite)
To actually shrink the file on disk, use VACUUM FULL:
VACUUM FULL VERBOSE customers;
SELECT
relname,
pg_size_pretty(pg_relation_size(relid)) AS table_size,
n_live_tup,
n_dead_tup
FROM pg_stat_user_tables
WHERE relname = 'customers';
Now the table size is back to its minimal size. But VACUUM FULL:
- Takes an ACCESS EXCLUSIVE lock — no reads or writes during the rewrite
- Rewrites the entire table and all its indexes
- Requires extra disk space equal to the table size (it builds a new copy)
Production rule of thumb: Use regular
VACUUM(via autovacuum) for day-to-day maintenance. UseVACUUM FULLonly during maintenance windows when you can tolerate downtime on that table.
Also vacuum the orders tables:
VACUUM FULL VERBOSE orders;
VACUUM FULL VERBOSE order_items;
Step 8 — Re-enable Autovacuum
Go back to Azure Portal → Server parameters → set autovacuum to ON → Save.
Verify:
SHOW autovacuum;
Expected: on
Step 9 — Understand Autovacuum Thresholds
Autovacuum triggers based on these parameters:
SHOW autovacuum_vacuum_threshold; -- default: 50
SHOW autovacuum_vacuum_scale_factor; -- default: 0.2
SHOW autovacuum_analyze_threshold; -- default: 50
SHOW autovacuum_analyze_scale_factor; -- default: 0.1
The formula for when autovacuum runs VACUUM on a table:
dead_tuples > autovacuum_vacuum_threshold + (autovacuum_vacuum_scale_factor × n_live_tup)
For the customers table (10,000 rows):
Threshold = 50 + (0.2 × 10,000) = 2,050 dead tuples
This means autovacuum will kick in after 2,050 dead tuples accumulate. For smaller tables, the fixed threshold of 50 dominates. For large tables (millions of rows), the 20% scale factor means autovacuum waits too long — a common tuning point in production.
Tip: For high-write tables, lower
autovacuum_vacuum_scale_factorto0.05or even0.01at the table level:ALTER TABLE orders SET (autovacuum_vacuum_scale_factor = 0.05);
Summary
| Concept | Key takeaway |
|---|---|
| UPDATE = DELETE + INSERT | Old row version stays on disk as a dead tuple |
| DELETE | Marks the row as dead; space is NOT freed |
| VACUUM | Marks dead tuple space as reusable within the table; does NOT shrink the file |
| VACUUM FULL | Rewrites the table, reclaims disk space, but takes an exclusive lock |
| autovacuum | Background process that runs VACUUM + ANALYZE automatically; never disable it in production |
| Bloat | If autovacuum can’t keep up, tables grow unboundedly — this is the #1 operational issue with PostgreSQL |
| Oracle/SQL Server difference | They put old versions in undo/tempdb; PostgreSQL puts them in the table itself |
After completing the VACUUM FULL in the hands-on lab, verify the customers table returned to its original size:
SELECT pg_size_pretty(pg_relation_size('customers')) AS customers_size;
Statistics and Query Planning

All exercises use the orders_demo database you restored earlier. Connect to it first:
psql "host=$PGHOST dbname=orders_demo user=$PGUSER sslmode=require"
EXPLAIN
Run EXPLAIN on the orders table (~100 000 rows) to see the default execution plan:
EXPLAIN SELECT * FROM orders;
Sample output:
Seq Scan on orders (cost=0.00..2541.00 rows=100000 width=24)
Check the statistics Postgres currently holds for this table:
SELECT relpages, reltuples FROM pg_class WHERE relname = 'orders';
If reltuples shows 0, the autovacuum hasn’t run yet. Force a refresh:
VACUUM ANALYZE orders;
SELECT relpages, reltuples FROM pg_class WHERE relname = 'orders';
Expected output (approximate):
relpages | reltuples
----------+-----------
541 | 100000
Check EXPLAIN again — the row estimate should now match reality:
EXPLAIN SELECT * FROM orders;
Seq Scan on orders (cost=0.00..2041.00 rows=100000 width=24)
How the planner calculates cost
The total cost of a sequential scan equals (relpages × seq_page_cost) + (reltuples × cpu_tuple_cost). Verify:
SELECT relpages * current_setting('seq_page_cost')::numeric
+ reltuples * current_setting('cpu_tuple_cost')::numeric
AS estimated_cost
FROM pg_class
WHERE relname = 'orders';
The result should match the cost in the EXPLAIN output above.
Adding a WHERE filter
EXPLAIN SELECT * FROM orders WHERE customer_id < 200;
Sample output:
Seq Scan on orders (cost=0.00..2291.00 rows=1990 width=24)
Filter: (customer_id < 200)
Add ANALYZE to see actual vs. estimated:
EXPLAIN ANALYZE SELECT * FROM orders WHERE customer_id < 200;
Sample output:
Seq Scan on orders (cost=0.00..2291.00 rows=1990 width=24) (actual time=0.021..12.345 rows=1999 loops=1)
Filter: (customer_id < 200)
Rows Removed by Filter: 98001
Planning Time: 0.08 ms
Execution Time: 12.50 ms
Now not only the plan was shown but also the query was executed.
Index scan vs. sequential scan
Create an index on customer_id and observe the plan change:
CREATE INDEX idx_orders_customer_id ON orders(customer_id);
EXPLAIN ANALYZE SELECT * FROM orders WHERE customer_id < 200;
Sample output:
Index Scan using idx_orders_customer_id on orders (cost=0.29..82.10 rows=1990 width=24) (actual time=0.015..0.350 rows=1999 loops=1)
Index Cond: (customer_id < 200)
Planning Time: 0.12 ms
Execution Time: 0.42 ms
Think about it: Why did the planner choose Index Scan rather than Index Only Scan? (Hint: the query selects columns not in the index.)
Join strategies
Use a join between orders and customers to explore how the planner picks join algorithms:
EXPLAIN ANALYZE
SELECT o.order_id, c.name, o.total_amount
FROM orders o
JOIN customers c ON c.customer_id = o.customer_id
WHERE o.customer_id < 200;
The planner will likely choose a Nested Loop — it can use the index on orders.customer_id to fetch a small number of rows, then look up each customer by primary key.
Now force the planner away from nested loops:
SET enable_nestloop TO off;
EXPLAIN ANALYZE
SELECT o.order_id, c.name, o.total_amount
FROM orders o
JOIN customers c ON c.customer_id = o.customer_id
WHERE o.customer_id < 200;
The plan switches to a Hash Join — it builds a hash table of the matching customers and probes it for each order.
Disable hash joins as well:
SET enable_hashjoin TO off;
EXPLAIN ANALYZE
SELECT o.order_id, c.name, o.total_amount
FROM orders o
JOIN customers c ON c.customer_id = o.customer_id
WHERE o.customer_id < 200;
The plan falls back to a Merge Join — both inputs must be sorted first.
Think about it: Which algorithm was the fastest for this query and why? Compare the Execution Time from each plan.
Cleanup
RESET enable_nestloop;
RESET enable_hashjoin;
DROP INDEX IF EXISTS idx_orders_customer_id;
Parameter Tuning
PostgreSQL has over 300 configuration parameters. Most are fine at their defaults, but a handful directly control memory allocation, query planning, and I/O behaviour. Getting these right for your workload is the difference between a server that flies and one that spills every sort to disk.
In this section you will tune the most impactful parameters using the orders_demo database, measure the effect on the demo workload, and understand how Azure Flexible Server handles defaults.
How to Change Parameters on Azure Flexible Server
There are two ways:
1. Azure Portal — Server parameters blade (GUI) 2. Azure CLI:
az postgres flexible-server parameter set \
--resource-group <rg> --server-name <server> \
--name work_mem --value "64MB"
Some parameters require a server restart (marked as static in the portal). Others apply immediately to new sessions (dynamic).
You can check the current value of any parameter from psql:
SHOW work_mem;
-- Or see all parameters with context:
SELECT name, setting, unit, context, short_desc
FROM pg_settings
WHERE name = 'work_mem';
The context column tells you when the change takes effect:
| Context | Meaning | Restart? |
|---|---|---|
user |
Can be changed per session with SET |
No |
superuser |
Requires azure_pg_admin role |
No |
postmaster |
Requires server restart | Yes |
sighup |
Applied on config reload (no restart) | No |
The Key Parameters
1. work_mem — Per-Operation Sort/Hash Memory
SHOW work_mem;
Default on Flexible Server: typically 4MB.
What it controls: The maximum amount of memory each sort, hash join, or hash aggregation operation can use before spilling to temp files on disk. Each query can use multiple work_mem allocations — a complex query with 5 sort/hash nodes uses up to 5 × work_mem.
The problem you saw: In the workload section, Query 3 (window functions) and Query 6 (DISTINCT ON) spilled to temp files. You saw this in:
pg_stat_database.temp_files> 0- EXPLAIN showing
Sort Method: external mergeinstead ofSort Method: quicksort
Lab — Measure the impact
Before (default work_mem):
SET work_mem = '4MB';
EXPLAIN (ANALYZE, BUFFERS)
SELECT DISTINCT ON (customer_id)
       customer_id, order_id, order_date, total_amount
FROM orders
ORDER BY customer_id, total_amount DESC, order_date DESC;
Look at the Sort node. If you see Sort Method: external merge Disk: XXXkB, it means the sort spilled to temp files.
After (increased work_mem):
SET work_mem = '64MB';
EXPLAIN (ANALYZE, BUFFERS)
SELECT DISTINCT ON (customer_id)
customer_id, order_id, order_date, total_amount
FROM orders
ORDER BY customer_id, total_amount DESC, order_date DESC;
Now the Sort node should show Sort Method: quicksort Memory: XXXkB — the entire sort fits in memory.
Compare execution times:
-- Reset to default and time it
SET work_mem = '4MB';
\timing -- meta-command: toggles execution timing on
SELECT DISTINCT ON (customer_id) customer_id, order_id, order_date, total_amount
FROM orders ORDER BY customer_id, total_amount DESC, order_date DESC;
-- Increase and time it again
SET work_mem = '64MB';
SELECT DISTINCT ON (customer_id) customer_id, order_id, order_date, total_amount
FROM orders ORDER BY customer_id, total_amount DESC, order_date DESC;
Also test with Query 3 (window functions):
SET work_mem = '4MB';
\timing -- meta-command: toggles execution timing on
SELECT order_id, customer_id, order_date, total_amount,
SUM(total_amount) OVER (PARTITION BY customer_id ORDER BY order_date) AS running_total,
ROW_NUMBER() OVER (PARTITION BY customer_id ORDER BY total_amount DESC) AS rank_by_amount
FROM orders;
SET work_mem = '64MB';
SELECT order_id, customer_id, order_date, total_amount,
SUM(total_amount) OVER (PARTITION BY customer_id ORDER BY order_date) AS running_total,
ROW_NUMBER() OVER (PARTITION BY customer_id ORDER BY total_amount DESC) AS rank_by_amount
FROM orders;
Sizing guideline:
Total memory budget for work_mem ≈ RAM × 0.25 / max_connections
For a 8GB server with 100 connections: 2048MB / 100 = ~20MB. Conservative, but avoids OOM under load.
Caution: Do not set
work_memglobally to very large values (e.g., 512MB). A burst of concurrent queries each allocating multiplework_membuffers can exhaust server memory. UseSETper-session for analytical queries instead.
Reset to default:
RESET work_mem;
2. shared_buffers — Shared Memory Cache
SHOW shared_buffers;
Default on Flexible Server: auto-tuned by Azure to ~25% of available memory.
What it controls: The size of PostgreSQL’s shared buffer pool — the in-memory cache for table and index data pages. Every read goes through this cache; a page found here avoids a disk read.
You already measured this: In the profiling section, pg_stat_database.blks_hit vs blks_read gives you the cache hit ratio. On a properly sized shared_buffers, you should see > 99% cache hit.
SELECT
blks_hit,
blks_read,
ROUND(100.0 * blks_hit / NULLIF(blks_hit + blks_read, 0), 2) AS cache_hit_pct
FROM pg_stat_database
WHERE datname = 'orders_demo';
Do you need to change it? On Azure Flexible Server, the default is almost always correct. Azure sets it relative to the SKU’s memory. Only change it if:
- Cache hit ratio is below 95% consistently
- You have a very specific workload that benefits from a larger cache
Note: Changing
shared_buffersrequires a server restart. This is apostmaster-context parameter.
3. effective_cache_size — Planner’s Cache Estimate
SHOW effective_cache_size;
Default on Flexible Server: auto-tuned to ~75% of available memory.
What it controls: This does not allocate any memory. It tells the query planner how much total cache (shared_buffers + OS page cache) is likely available. A higher value makes the planner more willing to choose index scans (since it assumes index pages are cached), while a lower value biases toward sequential scans.
Lab — See the planner’s behaviour change
-- Low estimate: planner assumes very little is cached
SET effective_cache_size = '64MB';
EXPLAIN SELECT * FROM orders WHERE customer_id = 42;
-- High estimate: planner assumes most data is cached
SET effective_cache_size = '4GB';
EXPLAIN SELECT * FROM orders WHERE customer_id = 42;
With a low effective_cache_size, the planner may choose a sequential scan (assuming random I/O to read index pages is expensive). With a high value, it chooses an index scan (assuming pages are likely in cache).
Reset:
RESET effective_cache_size;
4. maintenance_work_mem — Memory for Maintenance Operations
SHOW maintenance_work_mem;
Default: 64MB (on most Flexible Server SKUs).
What it controls: Memory available for VACUUM, CREATE INDEX, ALTER TABLE ADD FOREIGN KEY, and similar maintenance operations. These operations are single-threaded, so this is a per-operation allocation.
Lab — Index creation speed
-- Create with default maintenance_work_mem
SET maintenance_work_mem = '64MB';
\timing -- meta-command: toggles execution timing on
CREATE INDEX idx_maint_demo ON orders (customer_id, total_amount DESC, order_date DESC);
-- Drop and recreate with more memory
DROP INDEX idx_maint_demo;
SET maintenance_work_mem = '512MB';
CREATE INDEX idx_maint_demo ON orders (customer_id, total_amount DESC, order_date DESC);
Compare the creation times. With more memory, PostgreSQL can sort the index entries in memory instead of using temp files, making index creation faster.
Reset and clean up the test index:
DROP INDEX IF EXISTS idx_maint_demo;
RESET maintenance_work_mem;
Important: Drop the index before continuing. The Index Tuning Lab later in this chapter expects only primary-key indexes on the
orders_demotables. Leaving this index in place will skew the baseline measurements.
Guideline: Set to 256MB–1GB for index creation and VACUUM on large tables. It’s safe to set high because only one maintenance operation runs per connection.
5. random_page_cost — I/O Cost Estimate
SHOW random_page_cost;
Default: 4.0
What it controls: The planner’s estimate of the cost of a non-sequential (random) disk page fetch, relative to seq_page_cost (default 1.0). A higher value makes the planner prefer sequential scans (because it thinks random I/O is expensive). A lower value makes it prefer index scans.
When to lower it: On Azure Flexible Server with Premium SSD or Premium SSD v2 storage, random I/O is fast. A value of 1.1 to 2.0 is more appropriate than the default 4.0.
Lab — See the impact
-- Default: random I/O is considered 4× more expensive than sequential
SET random_page_cost = 4.0;
EXPLAIN SELECT * FROM orders WHERE customer_id BETWEEN 100 AND 200;
-- SSD-appropriate: random I/O is nearly the same cost as sequential
SET random_page_cost = 1.1;
EXPLAIN SELECT * FROM orders WHERE customer_id BETWEEN 100 AND 200;
With 4.0, the planner may choose a sequential scan for selective queries. With 1.1, it uses the index.
Reset:
RESET random_page_cost;
Parameter Summary Table
| Parameter | Default | Context | Controls | Tuning tip |
|---|---|---|---|---|
work_mem |
4MB | user |
Sort/hash memory per operation | Increase for analytical queries (SET per-session); don’t set globally above ~64MB |
shared_buffers |
~25% RAM | postmaster |
Shared buffer cache | Azure auto-tunes; only change if cache hit < 95% |
effective_cache_size |
~75% RAM | user |
Planner’s cache assumption | Azure auto-tunes; raise if planner avoids index scans |
maintenance_work_mem |
64MB | user |
VACUUM / CREATE INDEX memory | Set 256MB–1GB for maintenance windows |
random_page_cost |
4.0 | user |
Planner’s random I/O cost | Lower to 1.1–2.0 on SSD/Premium storage |
wal_buffers |
~3% shared_buffers | postmaster |
WAL write buffer | Almost never needs changing |
max_connections |
100 | postmaster |
Connection limit | Don’t increase beyond what PgBouncer serves; each connection uses ~5–10MB |
What About Azure Server Tiers?
Azure Flexible Server auto-configures several parameters based on your SKU:
| SKU | vCores | Memory | shared_buffers | effective_cache_size | max_connections |
|---|---|---|---|---|---|
| Burstable B1ms | 1 | 2 GB | 512 MB | 1.5 GB | 50 |
| GP Standard_D2ds_v4 | 2 | 8 GB | 2 GB | 6 GB | 859 |
| GP Standard_D4ds_v4 | 4 | 16 GB | 4 GB | 12 GB | 1719 |
| MO Standard_E2ds_v4 | 2 | 16 GB | 4 GB | 12 GB | 1719 |
Your workshop server (Standard_D2ds_v4) has 8GB RAM. Azure sets shared_buffers to ~2GB and effective_cache_size to ~6GB automatically.
Takeaway: On Flexible Server, focus your tuning on
work_mem(per-session),maintenance_work_mem(for maintenance), andrandom_page_cost(for SSD). The big memory parameters are already handled by Azure.
Index Tuning Lab — Fix the Broken Workload
This is the most satisfying section of the workshop. In the Run Demo Workload section you ran six intentionally unoptimised queries. In Monitoring you saw the CPU spikes and IOPS pressure they caused. In Statistics & Query Planning you learned how EXPLAIN works. Now you will fix the problems by adding the right indexes and comparing before/after performance.
Prerequisite: You need the
orders_demodatabase with the demo data. You should have\timingenabled andpg_stat_statementsinstalled.

Step 1 — Reset Statistics and Remove Stale Indexes
Start with a clean baseline so your before/after comparison is accurate:
psql -h <postgresql-fqdn> -U <pgadmin> -d orders_demo
\timing
-- Drop any indexes left over from earlier sections (e.g. parameter tuning, statistics)
DROP INDEX IF EXISTS idx_orders_cust_amount_date;
DROP INDEX IF EXISTS idx_orders_customer_id;
-- Reset table-level stats
SELECT pg_stat_reset();
-- Reset pg_stat_statements
SELECT pg_stat_statements_reset();
Step 2 — Confirm the Current State (No Indexes)
Check what indexes exist:
\di
You should see only primary key indexes:
customers_pkeyproducts_pkeyorders_pkeyorder_items_pkey
There are no indexes on foreign key columns (customer_id, product_id, order_id in child tables).
Step 3 — Run the Problem Queries and Record Baseline
Run each query and note the execution time. These are the same queries from the workload section.
Query 2 — Correlated Subquery (worst offender)
EXPLAIN (ANALYZE, BUFFERS)
SELECT c.customer_id, c.first_name, c.last_name,
(SELECT COUNT(*) FROM orders o WHERE o.customer_id = c.customer_id) AS order_count,
(SELECT COALESCE(SUM(total_amount),0) FROM orders o WHERE o.customer_id = c.customer_id) AS lifetime_value
FROM customers c
ORDER BY lifetime_value DESC
LIMIT 100;
What to look for in the plan:
Seq Scan on ordersinside the subquery — this runs once per customer (10,000 times)- Huge
actual loops=10000on the subquery nodes - High
Buffers: shared hit=...orshared read=...— repeated reads of the same pages
Record the Execution Time from the bottom of the EXPLAIN output.
Query 1 — Cross-Join Aggregation
EXPLAIN (ANALYZE, BUFFERS)
SELECT c.city, c.country, p.category,
COUNT(DISTINCT o.order_id) AS total_orders,
SUM(oi.quantity * oi.unit_price * (1 - oi.discount/100)) AS revenue
FROM customers c
JOIN orders o ON o.customer_id = c.customer_id
JOIN order_items oi ON oi.order_id = o.order_id
JOIN products p ON p.product_id = oi.product_id
GROUP BY c.city, c.country, p.category
ORDER BY revenue DESC;
What to look for: Hash Join or Merge Join nodes with Seq Scan on both sides of every join.
Query 6 — DISTINCT ON
EXPLAIN (ANALYZE, BUFFERS)
SELECT DISTINCT ON (customer_id)
customer_id, order_id, order_date, total_amount
FROM orders
ORDER BY customer_id, total_amount DESC, order_date DESC;
What to look for: Sort node with high Sort Space Used and possibly Sort Method: external merge (temp file spill).
Step 4 — Add the Missing Indexes
These are the indexes the demo database was designed to lack:
-- Foreign key: orders.customer_id (used by Q1, Q2, Q6)
CREATE INDEX idx_orders_customer_id ON orders (customer_id);
-- Foreign key: order_items.order_id (used by Q1, Q4, Q5)
CREATE INDEX idx_order_items_order_id ON order_items (order_id);
-- Foreign key: order_items.product_id (used by Q1, Q4)
CREATE INDEX idx_order_items_product_id ON order_items (product_id);
-- Composite for DISTINCT ON in Q6 (covers the sort order)
CREATE INDEX idx_orders_cust_amount_date ON orders (customer_id, total_amount DESC, order_date DESC);
-- For Q2 correlated subquery: covers both COUNT and SUM
CREATE INDEX idx_orders_cust_total ON orders (customer_id, total_amount);
Verify they were created:
\di
You should now see 9 indexes (4 PKs + 5 new).
Run ANALYZE to update planner statistics with the new indexes:
ANALYZE customers, orders, order_items, products;
Step 5 — Re-Run the Queries and Compare
Query 2 — Correlated Subquery (after indexing)
EXPLAIN (ANALYZE, BUFFERS)
SELECT c.customer_id, c.first_name, c.last_name,
(SELECT COUNT(*) FROM orders o WHERE o.customer_id = c.customer_id) AS order_count,
(SELECT COALESCE(SUM(total_amount),0) FROM orders o WHERE o.customer_id = c.customer_id) AS lifetime_value
FROM customers c
ORDER BY lifetime_value DESC
LIMIT 100;
Expected change: The subqueries now use Index Only Scan on idx_orders_cust_total instead of Seq Scan. The loops are still 10,000 but each loop reads a few index pages instead of scanning 100,000 rows.
Query 1 — Cross-Join Aggregation (after indexing)
EXPLAIN (ANALYZE, BUFFERS)
SELECT c.city, c.country, p.category,
COUNT(DISTINCT o.order_id) AS total_orders,
SUM(oi.quantity * oi.unit_price * (1 - oi.discount/100)) AS revenue
FROM customers c
JOIN orders o ON o.customer_id = c.customer_id
JOIN order_items oi ON oi.order_id = o.order_id
JOIN products p ON p.product_id = oi.product_id
GROUP BY c.city, c.country, p.category
ORDER BY revenue DESC;
Expected change: At least some joins switch from Hash Join (Seq Scan) to Nested Loop (Index Scan) or Merge Join (Index Scan), reducing buffer reads significantly.
Query 6 — DISTINCT ON (after indexing)
EXPLAIN (ANALYZE, BUFFERS)
SELECT DISTINCT ON (customer_id)
customer_id, order_id, order_date, total_amount
FROM orders
ORDER BY customer_id, total_amount DESC, order_date DESC;
Expected change: The Sort node disappears entirely. The planner uses Index Scan on idx_orders_cust_amount_date which is already sorted in the right order. No temp files needed.
Step 6 — Build the Comparison Table
Fill in your actual numbers:
| Query | Before (ms) | After (ms) | Speedup | Key Change |
|---|---|---|---|---|
| Q2 — Correlated subquery | _____ | _____ | ×_____ | Seq Scan → Index Only Scan |
| Q1 — Cross-join aggregation | _____ | _____ | ×_____ | Hash Join (Seq Scan) → Index lookups |
| Q6 — DISTINCT ON | _____ | _____ | ×_____ | Sort (external merge) → Index Scan |
Typical improvements you should see:
- Q2: 10–50× faster (the correlated subquery benefits most from indexing)
- Q1: 2–5× faster (still a large aggregation, but joins are cheaper)
- Q6: 3–10× faster (eliminates the sort entirely)
Step 7 — Check the New Sequential Scan Stats
SELECT
relname,
seq_scan,
seq_tup_read,
idx_scan,
idx_tup_fetch
FROM pg_stat_user_tables
WHERE relname IN ('customers', 'orders', 'order_items', 'products')
ORDER BY relname;
Compare idx_scan (should be high now) vs seq_scan (should be lower). Before indexing, idx_scan was 0 for most tables. Now it should dominate for the orders-related queries.
Step 8 — pg_stat_statements Comparison
SELECT
calls,
ROUND(total_exec_time::numeric, 2) AS total_ms,
ROUND(mean_exec_time::numeric, 2) AS mean_ms,
shared_blks_hit,
shared_blks_read,
temp_blks_written,
LEFT(query, 120) AS query
FROM pg_stat_statements
ORDER BY total_exec_time DESC
LIMIT 10;
After the indexes, the same queries should show:
- Lower
mean_ms - Lower
shared_blks_read(fewer disk reads) - Lower or zero
temp_blks_written(sorts fit in memory)
Step 9 — What Queries Don’t Benefit from Indexing?
Re-run Queries 3 and 5 to see that some workloads can’t be fixed with indexes alone:
Query 3 — Window Functions
\timing -- meta-command: toggles execution timing on
SELECT order_id, customer_id, order_date, total_amount,
SUM(total_amount) OVER (PARTITION BY customer_id ORDER BY order_date) AS running_total,
ROW_NUMBER() OVER (PARTITION BY customer_id ORDER BY total_amount DESC) AS rank_by_amount,
AVG(total_amount) OVER (PARTITION BY shipping_country ORDER BY order_date ROWS BETWEEN 100 PRECEDING AND CURRENT ROW) AS moving_avg
FROM orders;
Why indexing doesn’t help much: Window functions always need to process the entire result set. An index can help with the PARTITION BY sort, but PostgreSQL still reads every row. The real solution here is parameter tuning (work_mem) to avoid temp file spills.
Query 5 — md5 Loop
DO $$
BEGIN
FOR i IN 1..20 LOOP
PERFORM COUNT(*) FROM orders o
JOIN order_items oi ON oi.order_id = o.order_id
WHERE md5(o.status || oi.quantity::TEXT) LIKE '00%';
END LOOP;
END $$;
Why indexing doesn’t help: The WHERE clause applies a function (md5()) to column values. No B-tree index can satisfy md5(col) LIKE '00%' — every row must be read and the function evaluated. Solutions:
- A functional index on
md5(status || quantity::TEXT)— but only if this is a real query pattern - Rewrite the query to avoid the computed filter
Step 10 — Index Maintenance Awareness
Indexes aren’t free. Check how much space they now consume:
SELECT
tablename,
indexname,
pg_size_pretty(pg_relation_size(indexname::regclass)) AS index_size
FROM pg_indexes
WHERE schemaname = 'public'
ORDER BY pg_relation_size(indexname::regclass) DESC;
Trade-offs of indexes:
| Benefit | Cost |
|---|---|
| Faster SELECT queries | Slower INSERT / UPDATE / DELETE (each must update all indexes) |
| Reduced I/O for lookups | Additional disk space |
| Sorted access (avoids sorts) | Additional vacuum work (indexes have dead entries too) |
The goal is not “add indexes on everything” — it’s “add indexes where the read improvement justifies the write overhead.”
Summary
| Step | What you did | What you learned |
|---|---|---|
| Baseline | Ran queries with no indexes | Sequential scans on every join, temp file spills on sorts |
| Added 5 indexes | FK columns + composite + covering | Targeted the specific access patterns of the demo queries |
| After | Re-ran queries, measured improvement | 2–50× faster depending on query type |
| Limits | Tested Q3 and Q5 | Window functions and computed filters don’t benefit from standard indexes |
| Costs | Measured index sizes | Indexes have write overhead and space cost — add only what’s needed |
This completes the workshop’s break → measure → fix → prove cycle: you created a bad workload (Run Demo Workload), observed the damage (Monitoring), profiled it (DB Profiling), understood the planner (Statistics), and now fixed it with targeted indexes.
Query Rewriting — Fix What Indexes Can't
In the Index Tuning Lab you fixed three workload queries with indexes alone. But Queries 2, 3, and 5 still had room for improvement — or couldn’t be helped by B-tree indexes at all. This section shows how rewriting a query can be just as powerful as adding an index, and the two techniques stack.

All exercises use the orders_demo database. Connect first:
psql "host=$PGHOST dbname=orders_demo user=$PGUSER sslmode=require"
\timing
\pset pager off
Step 1 — Correlated Subquery → JOIN + GROUP BY
Original (Query 2):
EXPLAIN (ANALYZE, BUFFERS)
SELECT c.customer_id, c.first_name, c.last_name,
(SELECT COUNT(*) FROM orders o WHERE o.customer_id = c.customer_id) AS order_count,
(SELECT COALESCE(SUM(total_amount),0) FROM orders o WHERE o.customer_id = c.customer_id) AS lifetime_value
FROM customers c
ORDER BY lifetime_value DESC
LIMIT 100;
Even with an index, each correlated subquery still executes once per customer (10 000 loops). The planner cannot merge them.
Rewrite — single pass with a JOIN:
EXPLAIN (ANALYZE, BUFFERS)
SELECT c.customer_id, c.first_name, c.last_name,
COUNT(o.order_id) AS order_count,
COALESCE(SUM(o.total_amount), 0) AS lifetime_value
FROM customers c
LEFT JOIN orders o ON o.customer_id = c.customer_id
GROUP BY c.customer_id, c.first_name, c.last_name
ORDER BY lifetime_value DESC
LIMIT 100;
Why it is faster:
- A single
Hash AggregateorGroup Aggregatereplaces 20 000 index lookups. LEFT JOINpreserves customers who have zero orders (same semantics as theCOALESCEsubquery).
Compare the Execution Time values side by side.
Step 2 — EXISTS vs IN
A common anti-pattern is IN (SELECT …) with a large subquery. PostgreSQL can sometimes flatten it, but not always.
Slow — IN with subquery:
EXPLAIN (ANALYZE, BUFFERS)
SELECT customer_id, first_name, last_name
FROM customers
WHERE customer_id IN (
SELECT DISTINCT customer_id FROM orders WHERE total_amount > 500
);
Faster — EXISTS (semi-join):
EXPLAIN (ANALYZE, BUFFERS)
SELECT c.customer_id, c.first_name, c.last_name
FROM customers c
WHERE EXISTS (
SELECT 1 FROM orders o
WHERE o.customer_id = c.customer_id AND o.total_amount > 500
);
Why it can be faster: EXISTS stops scanning the inner table as soon as it finds the first matching row. IN may build and sort the full subquery result before probing. Check the EXPLAIN plans — look for Semi Join vs Hash Join.
Tip: Modern PostgreSQL (≥ 12) often rewrites
INinto a semi-join automatically. If both plans look identical, PostgreSQL already optimised for you. The habit still matters when working with older versions or complex subqueries.
Step 3 — Replace SELECT * with Explicit Columns
Run two versions of a simple lookup and compare the buffer counts:
-- Reads every column from the heap
EXPLAIN (ANALYZE, BUFFERS)
SELECT * FROM orders WHERE customer_id = 42;
-- Can use an Index Only Scan if a covering index exists
EXPLAIN (ANALYZE, BUFFERS)
SELECT order_id, order_date, total_amount
FROM orders WHERE customer_id = 42;
If idx_orders_cust_amount_date from the Index Tuning Lab is still in place, the second query can satisfy the request entirely from the index (Index Only Scan) — zero heap fetches.
Rule of thumb: Only request the columns you need. This enables covering indexes and reduces I/O.
Step 4 — LATERAL JOIN for Top-N-Per-Group
Suppose you need the three most recent orders per customer. A common approach uses ROW_NUMBER():
EXPLAIN (ANALYZE, BUFFERS)
SELECT *
FROM (
SELECT c.customer_id, c.first_name, o.order_id, o.order_date, o.total_amount,
ROW_NUMBER() OVER (PARTITION BY c.customer_id ORDER BY o.order_date DESC) AS rn
FROM customers c
JOIN orders o ON o.customer_id = c.customer_id
) sub
WHERE rn <= 3;
This scans and sorts all 100 000 orders, then discards everything beyond rank 3.
Rewrite — LATERAL subquery:
EXPLAIN (ANALYZE, BUFFERS)
SELECT c.customer_id, c.first_name,
lat.order_id, lat.order_date, lat.total_amount
FROM customers c
CROSS JOIN LATERAL (
SELECT o.order_id, o.order_date, o.total_amount
FROM orders o
WHERE o.customer_id = c.customer_id
ORDER BY o.order_date DESC
LIMIT 3
) lat;
Why it is faster: For each customer, the LATERAL subquery fetches only 3 rows using an index seek + LIMIT instead of sorting the entire table. With the idx_orders_customer_id index in place, each probe is a fast index scan.
Compare the Execution Time and Buffers: shared hit values.
Step 5 — CTE vs Subquery Materialisation
Before PostgreSQL 12, CTEs (WITH queries) were always materialised — the planner could not push predicates into them. Since PostgreSQL 12+, the planner can inline CTEs unless you add MATERIALIZED.
Inlined (default in PG 12+):
EXPLAIN (ANALYZE, BUFFERS)
WITH big_orders AS (
SELECT order_id, customer_id, total_amount
FROM orders
WHERE total_amount > 500
)
SELECT c.first_name, c.last_name, bo.total_amount
FROM customers c
JOIN big_orders bo ON bo.customer_id = c.customer_id
WHERE c.country = 'Germany';
Forced materialisation:
EXPLAIN (ANALYZE, BUFFERS)
WITH big_orders AS MATERIALIZED (
SELECT order_id, customer_id, total_amount
FROM orders
WHERE total_amount > 500
)
SELECT c.first_name, c.last_name, bo.total_amount
FROM customers c
JOIN big_orders bo ON bo.customer_id = c.customer_id
WHERE c.country = 'Germany';
Compare the two plans. In the inlined version, PostgreSQL pushes the country = 'Germany' filter into the join, reducing the number of rows early. In the materialised version, the CTE scans all orders with total_amount > 500 first, then filters by country — more work.
When to use MATERIALIZED: When a CTE is referenced multiple times in the outer query and is expensive to re-evaluate. Otherwise, let the planner inline it.
Step 6 — Expression Index for Computed Filters
Query 5 from the workload uses md5(o.status || oi.quantity::TEXT) LIKE '00%'. No B-tree index helps because the WHERE clause applies a function to column values.
Create a functional index:
CREATE INDEX idx_oi_md5_status_qty
ON order_items ((md5(
(SELECT status FROM orders WHERE orders.order_id = order_items.order_id)
|| quantity::TEXT)));
That won’t work — you can’t reference another table inside an index expression.
Practical alternative — precompute in a materialised view or rewrite the filter:
-- Instead of computing md5 at query time, filter by the columns directly
EXPLAIN (ANALYZE, BUFFERS)
SELECT COUNT(*)
FROM orders o
JOIN order_items oi ON oi.order_id = o.order_id
WHERE o.status = 'shipped' AND oi.quantity > 5;
Lesson: If you find yourself computing hashes in a WHERE clause, ask whether the business requirement can be expressed with direct column filters. md5-based filters are testing artefacts, not production patterns. When you genuinely need a computed filter, a generated column + index is the clean solution:
-- Example: generated column (don't run — just for illustration)
ALTER TABLE orders ADD COLUMN status_hash TEXT
GENERATED ALWAYS AS (md5(status)) STORED;
CREATE INDEX idx_orders_status_hash ON orders (status_hash);
Summary
| Technique | When to Use | Typical Gain |
|---|---|---|
| Correlated subquery → JOIN | Subquery runs once per outer row | 5–50× |
| EXISTS vs IN | Checking membership in a large set | 1–5× (PG often auto-optimises) |
| Explicit columns vs SELECT * | Covering index available | 2–10× (avoids heap fetch) |
| LATERAL JOIN | Top-N-per-group patterns | 3–20× vs ROW_NUMBER() |
| CTE inlining (PG 12+) | Single-use CTEs with outer filters | 2–5× |
| Expression / generated index | Computed WHERE filters | Varies — eliminate the computation |
Key takeaway: Indexing and query rewriting are complementary. Indexes speed up access paths; rewrites reduce how much work PostgreSQL needs to do in the first place. Always check EXPLAIN (ANALYZE, BUFFERS) before and after.
SQL Characteristics
Partial Index
Let’s create a new table in the orders_demo database and load it with some data:
\c orders_demo
CREATE SCHEMA IF NOT EXISTS games;
SET SEARCH_PATH TO games;
DROP TABLE IF EXISTS games;
CREATE TABLE games
(
id BIGINT PRIMARY KEY GENERATED BY DEFAULT AS IDENTITY,
start_time TIMESTAMP NOT NULL DEFAULT now(),
end_time TIMESTAMP NOT NULL,
players INTEGER[] NOT NULL,
winner INTEGER,
is_activ BOOLEAN DEFAULT TRUE
);
INSERT INTO games (start_time, end_time, players, winner, is_activ)
SELECT d, d + '1 hour', ('{' || n || ',' || n + 4 || '}')::INT[], n, TRUE
FROM generate_series(1, 10000) n,
generate_series('2021-01-01'::TIMESTAMP, now()::TIMESTAMP, '1 day'::INTERVAL) d
;
Check how many rows were added:
SELECT count(*) FROM games;
Update some of the rows so is_activ field will have value FALSE for all the rows where start_time is different than today:
UPDATE games SET is_activ = FALSE WHERE start_time::date <> CURRENT_DATE;
Check how many of the rows have flag is_activ set to TRUE:
SELECT count(*) FROM games WHERE is_activ;
Run the same query 4-5 times again and check it’s execution time:
SELECT count(*) FROM games WHERE is_activ;
Were subsequent executions faster than the first and could you explain why?
Let’s create a partial index using is_activ column:
CREATE INDEX ON games(id) WHERE is_activ;
Check again how much time this query needs to be executed:
SELECT count(*) FROM games WHERE is_activ;
JSONB
Create a table containing JSONB column and populate it with some data:
CREATE TABLE products
(
name TEXT,
attributes JSONB
);
INSERT INTO products (name, attributes)
VALUES ('Leffe Blonde Ale',
'{
"category": "Golden / Blonde Ale",
"region": "Belgium",
"ABV": 6.6
}');
Query the table using JSON operators:
SELECT name, attributes -> 'ABV'
FROM products;
SELECT name, attributes ->> 'ABV'
FROM products
WHERE attributes ->> 'region' = 'Belgium';
Create the GIN index on the table:
CREATE INDEX ON products USING gin(attributes);
Add more products with varied structures to demonstrate JSONB’s schema flexibility:
INSERT INTO products (name, attributes) VALUES
('Chimay Blue',
'{"category": "Belgian Strong Dark Ale", "region": "Belgium", "ABV": 9.0}'),
('Brooklyn Lager',
'{"category": "American Amber Lager", "region": "United States", "ABV": 5.2,
"awards": ["World Beer Cup 2010"]}'),
('Guinness Draught',
'{"category": "Dry Stout", "region": "Ireland", "ABV": 4.2}'),
('Punk IPA',
'{"category": "American IPA", "region": "Scotland", "ABV": 5.6,
"hops": ["Chinook", "Ahtanum", "Nelson Sauvin"]}');
Filtering and Operators
Use -> to extract a value as a JSON object, ->> to extract as text for comparison:
-- Return ABV as text for all products
SELECT name, attributes ->> 'ABV' AS abv
FROM products;
-- Filter: beers above 5% ABV
SELECT name, (attributes ->> 'ABV')::numeric AS abv
FROM products
WHERE (attributes ->> 'ABV')::numeric > 5.0
ORDER BY abv DESC;
Use the containment operator @> — this is what GIN indexes are optimised for:
-- All beers from Belgium
SELECT name FROM products
WHERE attributes @> '{"region": "Belgium"}';
Check key existence with ?:
-- Products that have an awards list
SELECT name FROM products
WHERE attributes ? 'awards';
Access an element inside a nested array with #>>:
SELECT name, attributes #>> '{hops,0}' AS first_hop
FROM products
WHERE attributes ? 'hops';
Verify the GIN index is used for containment queries:
EXPLAIN SELECT name FROM products
WHERE attributes @> '{"region": "Belgium"}';
Updating JSONB Fields
Add or update a specific key without replacing the whole document:
UPDATE products
SET attributes = jsonb_set(attributes, '{stock}', '42')
WHERE name = 'Punk IPA';
SELECT name, attributes -> 'stock' FROM products WHERE name = 'Punk IPA';
Remove a key with the - operator:
UPDATE products
SET attributes = attributes - 'stock'
WHERE name = 'Punk IPA';
Expanding JSONB to Rows
Use jsonb_each_text to pivot every key/value pair into rows — useful for generic attribute reporting:
SELECT name, key, value
FROM products,
jsonb_each_text(attributes)
ORDER BY name, key;
When to Use JSONB
| Use JSONB when | Use regular columns when |
|---|---|
| Attribute set varies per row | Schema is fixed and well-known |
| Storing third-party payloads as-is | Frequent aggregations on the field |
| Schema is evolving / prototype stage | Column-level NOT NULL / CHECK constraints needed |
Note: GIN indexes accelerate containment (
@>) and key-existence (?) lookups, but each write to the indexed column carries extra overhead. Only add a GIN index when the JSONB column is frequently queried with@>or?.
Table Partitioning
As tables grow into the millions of rows, even well-indexed queries slow down because indexes themselves become large. Partitioning splits a logical table into smaller physical pieces so the planner can skip entire partitions it doesn’t need — a technique called partition pruning.

All exercises use the orders_demo database. Connect first:
psql "host=$PGHOST dbname=orders_demo user=$PGUSER sslmode=require"
\timing
\pset pager off
Step 1 — Create a Partitioned Table (Range by Date)
Create a partitioned copy of the orders table, split by order_date into quarterly partitions:
CREATE TABLE orders_partitioned (
order_id INTEGER NOT NULL,
customer_id INTEGER NOT NULL,
order_date DATE NOT NULL,
total_amount NUMERIC(10,2),
status VARCHAR(20),
shipping_country VARCHAR(50)
) PARTITION BY RANGE (order_date);
Create partitions for each quarter:
CREATE TABLE orders_p_2024_q1 PARTITION OF orders_partitioned
FOR VALUES FROM ('2024-01-01') TO ('2024-04-01');
CREATE TABLE orders_p_2024_q2 PARTITION OF orders_partitioned
FOR VALUES FROM ('2024-04-01') TO ('2024-07-01');
CREATE TABLE orders_p_2024_q3 PARTITION OF orders_partitioned
FOR VALUES FROM ('2024-07-01') TO ('2024-10-01');
CREATE TABLE orders_p_2024_q4 PARTITION OF orders_partitioned
FOR VALUES FROM ('2024-10-01') TO ('2025-01-01');
-- Catch-all for dates outside the defined ranges
CREATE TABLE orders_p_default PARTITION OF orders_partitioned DEFAULT;
Note: The upper bound in
FOR VALUES FROM … TO …is exclusive. A row dated2024-04-01lands in Q2, not Q1.
Load data from the existing orders table:
INSERT INTO orders_partitioned
SELECT order_id, customer_id, order_date, total_amount, status, shipping_country
FROM orders;
Verify the distribution:
SELECT tableoid::regclass AS partition, COUNT(*) AS rows
FROM orders_partitioned
GROUP BY tableoid
ORDER BY partition;
Step 2 — Partition Pruning with EXPLAIN
Run a query that filters by date on both the original table and the partitioned table:
-- Unpartitioned: scans all 100 000 rows
EXPLAIN (ANALYZE, BUFFERS)
SELECT COUNT(*), SUM(total_amount)
FROM orders
WHERE order_date BETWEEN '2024-07-01' AND '2024-09-30';
-- Partitioned: prunes to Q3 only
EXPLAIN (ANALYZE, BUFFERS)
SELECT COUNT(*), SUM(total_amount)
FROM orders_partitioned
WHERE order_date BETWEEN '2024-07-01' AND '2024-09-30';
What to look for in the EXPLAIN output:
- The partitioned query shows
Seq Scan on orders_p_2024_q3— only one partition is touched. - Other partitions are listed with
(never executed)or omitted entirely. - Compare
Buffers: shared hit— the partitioned query reads far fewer pages.
Verify that pruning is enabled:
SHOW enable_partition_pruning; -- should be 'on' (default)
Step 3 — List Partitioning (by Status)
Not all partitioning is date-based. List partitioning is useful when rows fall into a fixed set of categories:
CREATE TABLE orders_by_status (
order_id INTEGER NOT NULL,
customer_id INTEGER NOT NULL,
order_date DATE NOT NULL,
total_amount NUMERIC(10,2),
status VARCHAR(20) NOT NULL,
shipping_country VARCHAR(50)
) PARTITION BY LIST (status);
CREATE TABLE orders_status_pending PARTITION OF orders_by_status FOR VALUES IN ('pending');
CREATE TABLE orders_status_shipped PARTITION OF orders_by_status FOR VALUES IN ('shipped');
CREATE TABLE orders_status_delivered PARTITION OF orders_by_status FOR VALUES IN ('delivered');
CREATE TABLE orders_status_other PARTITION OF orders_by_status DEFAULT;
INSERT INTO orders_by_status
SELECT order_id, customer_id, order_date, total_amount, status, shipping_country
FROM orders;
Test pruning:
EXPLAIN (ANALYZE)
SELECT COUNT(*) FROM orders_by_status WHERE status = 'pending';
Only the orders_status_pending partition is scanned.
Step 4 — Indexes on Partitioned Tables
Indexes on the parent table are automatically created on all partitions:
CREATE INDEX idx_orders_part_customer ON orders_partitioned (customer_id);
Verify with psql:
\di orders_p_*
Each partition now has its own idx_orders_part_customer index. The planner combines pruning (skip partitions) with index scan (fast lookup within the partition):
EXPLAIN (ANALYZE, BUFFERS)
SELECT order_id, order_date, total_amount
FROM orders_partitioned
WHERE order_date BETWEEN '2024-07-01' AND '2024-09-30'
AND customer_id = 42;
Step 5 — Attach and Detach Partitions
A common operations pattern is to attach new partitions for upcoming periods and detach old ones for archival.
Create a new partition for Q1 2025:
-- Create the table first (could be loaded offline)
CREATE TABLE orders_p_2025_q1 (LIKE orders_partitioned INCLUDING DEFAULTS INCLUDING CONSTRAINTS);
-- Attach it (instant metadata operation)
ALTER TABLE orders_partitioned
ATTACH PARTITION orders_p_2025_q1 FOR VALUES FROM ('2025-01-01') TO ('2025-04-01');
Detach an old partition for archival:
-- Detach without blocking concurrent reads (PG 14+)
ALTER TABLE orders_partitioned DETACH PARTITION orders_p_2024_q1 CONCURRENTLY;
CONCURRENTLY (PostgreSQL 14+) avoids an
ACCESS EXCLUSIVElock on the parent table. Without it, all queries againstorders_partitionedare blocked during the detach.
The detached table still exists as a standalone table — you can query it, archive it, or drop it:
SELECT COUNT(*) FROM orders_p_2024_q1; -- still accessible as a regular table
Step 6 — Cleanup
DROP TABLE IF EXISTS orders_partitioned CASCADE;
DROP TABLE IF EXISTS orders_by_status CASCADE;
DROP TABLE IF EXISTS orders_p_2024_q1; -- was detached, so not dropped by CASCADE
When to Partition
| Scenario | Partition Strategy | Why |
|---|---|---|
| Time-series data (logs, orders, events) | Range by date | Prune old months, archive by detaching |
| Status / category-based queries | List by status | Each status gets its own small table |
| Even distribution across workers | Hash by ID | Useful for parallel query / sharding |
| Table < 1M rows | Don’t partition | Overhead outweighs benefit for small tables |
Key trade-offs:
| Benefit | Cost |
|---|---|
| Partition pruning skips irrelevant data | More complex DDL and maintenance |
| Smaller per-partition indexes | Cross-partition queries (no filter on partition key) scan all partitions |
| Easy data lifecycle (attach/detach) | Unique constraints must include the partition key |
| Parallel scans across partitions | Foreign keys referencing partitioned tables require PG 12+ |
Rule of thumb: Partition when a table has millions of rows, queries consistently filter on the partition key, and you have a data lifecycle requirement (archival, retention).
Extensions Overview (Optional)
This section is optional. Complete it at your own pace if time permits, or after the workshop as self-study.
Extensions are what make PostgreSQL uniquely powerful. They let you add new data types, functions, index methods, and even entire subsystems without forking the core engine. Azure Flexible Server supports a curated list of extensions — you don’t install binaries, you just CREATE EXTENSION.
Step 1 — See What’s Available
From the jumpbox, connect to orders_demo:
psql -h <postgresql-fqdn> -U <pgadmin> -d orders_demo
List all extensions that Azure Flexible Server allows:
SHOW azure.extensions;
This returns a comma-separated list. To see the full catalog of extensions available for installation:
SELECT name, default_version, comment
FROM pg_available_extensions
ORDER BY name;
List extensions already installed in this database:
SELECT extname, extversion
FROM pg_extension
ORDER BY extname;
You should see at least plpgsql (always installed) and pg_stat_statements (if you enabled it in the Monitoring section).
Step 2 — pg_stat_statements (Already in Use)
You have already been using this throughout the workshop. Quick recap:
CREATE EXTENSION IF NOT EXISTS pg_stat_statements;
-- Top queries by execution time
SELECT calls, ROUND(total_exec_time::numeric, 2) AS total_ms,
ROUND(mean_exec_time::numeric, 2) AS mean_ms,
LEFT(query, 120) AS query
FROM pg_stat_statements
ORDER BY total_exec_time DESC
LIMIT 10;
This extension is critical for production — it’s how you find your slowest queries.
Step 3 — pg_trgm (Trigram Text Search)
pg_trgm provides fast text similarity searches — useful for fuzzy matching, autocomplete, and LIKE '%pattern%' queries that can’t use standard B-tree indexes.
CREATE EXTENSION IF NOT EXISTS pg_trgm;
Lab — Fuzzy Customer Search
Without an index, a LIKE search on a text column is always a sequential scan:
EXPLAIN (ANALYZE)
SELECT customer_id, first_name, last_name, email
FROM customers
WHERE email LIKE '%jones%';
You will see Seq Scan and Filter. Now add a trigram GIN index:
CREATE INDEX idx_customers_email_trgm ON customers USING gin (email gin_trgm_ops);
Re-run:
EXPLAIN (ANALYZE)
SELECT customer_id, first_name, last_name, email
FROM customers
WHERE email LIKE '%jones%';
The planner now uses Bitmap Index Scan on the GIN index — much faster.
Similarity search:
-- Find customers with names similar to "Smith" (typo-tolerant)
SELECT customer_id, first_name, last_name, similarity(last_name, 'Smith') AS sim
FROM customers
WHERE last_name % 'Smith'
ORDER BY sim DESC
LIMIT 10;
The % operator returns true if the similarity score exceeds pg_trgm.similarity_threshold (default 0.3).
Clean up:
DROP INDEX idx_customers_email_trgm;
Step 4 — uuid-ossp and gen_random_uuid()
For generating UUIDs (common for distributed IDs, API keys, etc.):
-- PostgreSQL 18: gen_random_uuid() is built-in, no extension needed
SELECT gen_random_uuid();
-- If you need other UUID versions (v1, v3, v5):
CREATE EXTENSION IF NOT EXISTS "uuid-ossp";
SELECT uuid_generate_v4(); -- random UUID (same as gen_random_uuid)
SELECT uuid_generate_v1(); -- time + MAC-based UUID
Step 5 — pgcrypto (Hashing & Encryption)
For password hashing, data encryption, and generating random bytes:
CREATE EXTENSION IF NOT EXISTS pgcrypto;
-- Hash a password with bcrypt (adaptive cost)
SELECT crypt('my_password', gen_salt('bf', 10)) AS hashed;
-- Verify a password
SELECT (crypt('my_password', hashed) = hashed) AS password_matches
FROM (SELECT crypt('my_password', gen_salt('bf', 10)) AS hashed) sub;
-- Generate random bytes (useful for tokens)
SELECT encode(gen_random_bytes(32), 'hex') AS random_token;
Step 6 — pg_cron (Scheduled Jobs)
pg_cron lets you schedule recurring SQL jobs directly in PostgreSQL — like a database-level cron. On Azure Flexible Server, it’s available via server parameters.
Enable pg_cron:
- Azure Portal → Server parameters
- Search for
shared_preload_libraries→ ensurepg_cronis checked - Search for
cron.database_name→ set toorders_demo - Save (requires restart)
After restart:
CREATE EXTENSION IF NOT EXISTS pg_cron;
-- Schedule a vacuum every night at 3am UTC
SELECT cron.schedule('nightly-vacuum', '0 3 * * *', 'VACUUM ANALYZE orders');
-- Schedule a stats reset every Sunday
SELECT cron.schedule('weekly-stats-reset', '0 0 * * 0', 'SELECT pg_stat_reset()');
-- List scheduled jobs
SELECT * FROM cron.job;
-- Remove a job
SELECT cron.unschedule('nightly-vacuum');
Step 7 — Explore with orders_demo
Try these extension-powered queries against the demo data:
Trigram search — find orders from cities like “London”:
CREATE INDEX idx_cust_city_trgm ON customers USING gin (city gin_trgm_ops);
-- Typo-tolerant city search
SELECT customer_id, city, country
FROM customers
WHERE city % 'Londen'
ORDER BY similarity(city, 'Londen') DESC
LIMIT 10;
DROP INDEX idx_cust_city_trgm;
Generate UUIDs for anonymised export:
SELECT gen_random_uuid() AS anon_id, city, country, loyalty_points
FROM customers
LIMIT 5;
Hash email addresses for privacy:
SELECT customer_id,
encode(digest(email, 'sha256'), 'hex') AS email_hash,
city, country
FROM customers
LIMIT 5;
Quick Reference — Commonly Used Extensions
| Extension | Purpose | Requires Restart? |
|---|---|---|
pg_stat_statements |
Query performance statistics | Yes (shared_preload_libraries) |
pg_trgm |
Trigram text similarity & fuzzy search | No |
uuid-ossp |
UUID generation (v1, v3, v4, v5) | No |
pgcrypto |
Hashing, encryption, random data | No |
pg_cron |
Scheduled jobs (cron syntax) | Yes (shared_preload_libraries) |
postgis |
Geographic/spatial data & queries | No |
hstore |
Key-value store data type | No |
citext |
Case-insensitive text type | No |
pg_buffercache |
Inspect shared buffer contents | No |
pg_prewarm |
Preload tables/indexes into cache | No |
azure_storage |
Query Azure Blob Storage from SQL | No |
Clean Up
Remove the extensions you installed (optional — they don’t affect the other sections):
DROP EXTENSION IF EXISTS pg_trgm;
DROP EXTENSION IF EXISTS "uuid-ossp";
DROP EXTENSION IF EXISTS pgcrypto;
-- Keep pg_stat_statements — it's used throughout the workshop
Clean up
⚠️ DISCLAIMER — Read before you delete anything. The steps below will permanently delete all resources inside the
PG-Workshopresource group, including the PostgreSQL Flexible Server, virtual machines, virtual networks, storage accounts, and any data they contain. This action cannot be undone. Only proceed if:
- You have finished the workshop and no longer need the environment.
- You have confirmed the resource group name matches exactly what you created (
PG-Workshop).- You are operating in a non-production subscription used for this lab only. If you are unsure, do not delete — contact your subscription owner first.
Step 1 — Confirm the Resource Group Before Deleting
List the resources inside the group first so you can visually confirm nothing critical is there:
az resource list --resource-group PG-Workshop --output table
You should see the resources you created: the PostgreSQL Flexible Server, jumpbox VM, virtual networks, and DNS zone. If you see anything unexpected, stop and investigate.
Step 2 — Delete the Entire Resource Group
Deleting the resource group removes all resources inside it in a single operation:
Azure Portal:
- Go to Resource groups in the Azure Portal.
- Click on
PG-Workshop. - Click Delete resource group at the top.
- Type
PG-Workshopin the confirmation box to confirm. - Click Delete.
Azure CLI (from CloudShell or your terminal):
az group delete --name PG-Workshop --yes --no-wait
The --no-wait flag returns control immediately; deletion continues in the background. You can check progress in the Azure Portal under Activity log.
Step 3 — Verify Deletion
After a few minutes, confirm the resource group is gone:
az group show --name PG-Workshop
You should see: ResourceGroupNotFound. If resources still appear, wait and retry — large deployments can take 5–10 minutes to fully remove.
Step 4 — Clean Up Local Files (Optional)
Remove any credentials or connection files you created on the jumpbox or locally:
# On the jumpbox (if still accessible before VM is deleted)
rm -f ~/.pg_azure ~/.pgpass
You can also read manage Azure resources by using the Azure portal or manage Azure resources by using Azure CLI for more details.
Contributors
The following people have contributed to this workshop, thanks!


